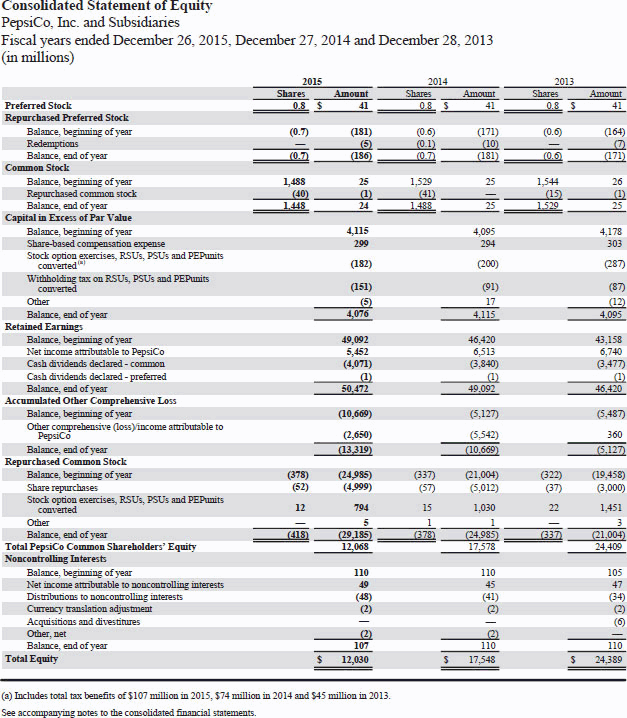
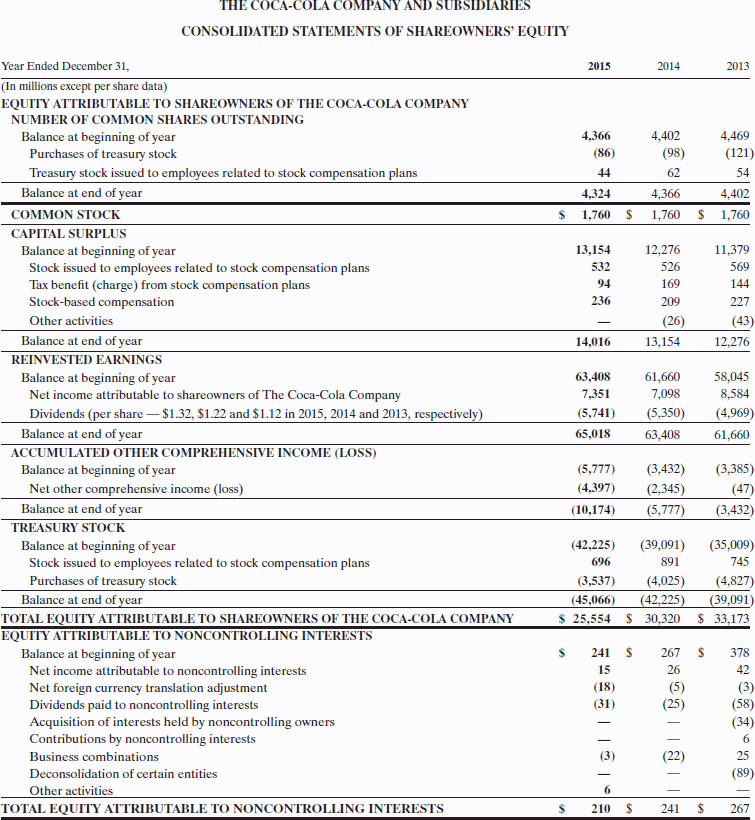
 Comparative Analysis Problem: PepsiCo, Inc. vs. The Coca-Cola Company CT11-2. PepsiCo, Inc.'s financial statements are presented in Appendix B. Financial statements of The Coca-Cola Company are presented in Appendix C. Instructions for accessing and using the complete annual reports of PepsiCo and Coca-Cola, including the notes to the financial statements, are also provided in Appendices B and C, respectively. Instructions (a) What percentage of authorized shares was issued by Coca-Cola at December 31, 2015, and by PepsiCo at December 26, 2015? (b) How many shares are held as treasury stock by Coca-Cola at December 31, 2015, and by PepsiCo at December 26, 2015? (c) How many Coca-Cola common shares are outstanding at December 31, 2015? How many PepsiCo shares of common stock are outstanding at December 26, 2015? (d) Compute earnings per share and return on common stockholders' equity for both companies for 2015. Assume PepsiCo's weighted-average shares were 1,469 million and Coca-Cola's weighted-average shares were 4,352 million. Can these measures be used to compare the profitability of the two companies? Why or why not? (e) What was the total amount of dividends paid by each company in 2015?
Consolidated Statement of Equity PepsiCo, Inc. and Subsidiaries Fiscal years ended December 26, 2015, December 27, 2014 and December 28, 2013 (in millions) 2015 2014 Amount Preferred Stock Repurchased Preferred Stock Balance, beginning of year (181) (0.6 (171) (0.6) (164) Balance, end of year Common Stock 1488 1,544 Balance, beginning of year Repurchased common stock Balance, end of year Capital in Ercess of Par Value 4115 4.095 4,178 Balance, beginning of year Stock option exercises, RSUs, PSUs and PEPunits Withholding tax on RSUs, PSUs and PEPunits (182) (151) 076 (91) Balance, end of year Retained Earnings 46,420 Balance, beginning of year Net income atuributable to PepsiCo Cash dividends declared- common Cash dividends declared preferred Balance, end of year 49,092 5,452 (4,071) 43,158 6,740 50.47 49.092 Accumulated Other Comprehensive Loss (10,669) (2,650) (5,487) Balance, beginning of year Other conprehensive loss)income atuibutable to (5,542) 10 Balance, end of year Repurchased Common Stock (378) (24,985) (4,999) 337) 21,004) (5,012) (322) Balance, beginning of year Share repurchases Stock option exercises, RSUs, PsUs and PEPunits (19,458) 6,000) 1,451 62) 15 29,185 12,068 Balance, end of year 24.985 Total PepsiCo Common Shareholders' Equity Noncontrolling Interests 4,409 Balance, beginning of year 110 105 Net income attibutable to noncontrolling interests Currency translation adjustment Other, net (41) 110 S 24,389 Balance, end of year Total Equity $ 12,030 S 17,548 (a) Includes total tax benefits of $107 million in 2015, $74 million in 2014 and $45 million in 2013. Consolidated Statement of Equity PepsiCo, Inc. and Subsidiaries Fiscal years ended December 26, 2015, December 27, 2014 and December 28, 2013 (in millions) 2015 2014 Amount Preferred Stock Repurchased Preferred Stock Balance, beginning of year (181) (0.6 (171) (0.6) (164) Balance, end of year Common Stock 1488 1,544 Balance, beginning of year Repurchased common stock Balance, end of year Capital in Ercess of Par Value 4115 4.095 4,178 Balance, beginning of year Stock option exercises, RSUs, PSUs and PEPunits Withholding tax on RSUs, PSUs and PEPunits (182) (151) 076 (91) Balance, end of year Retained Earnings 46,420 Balance, beginning of year Net income atuributable to PepsiCo Cash dividends declared- common Cash dividends declared preferred Balance, end of year 49,092 5,452 (4,071) 43,158 6,740 50.47 49.092 Accumulated Other Comprehensive Loss (10,669) (2,650) (5,487) Balance, beginning of year Other conprehensive loss)income atuibutable to (5,542) 10 Balance, end of year Repurchased Common Stock (378) (24,985) (4,999) 337) 21,004) (5,012) (322) Balance, beginning of year Share repurchases Stock option exercises, RSUs, PsUs and PEPunits (19,458) 6,000) 1,451 62) 15 29,185 12,068 Balance, end of year 24.985 Total PepsiCo Common Shareholders' Equity Noncontrolling Interests 4,409 Balance, beginning of year 110 105 Net income attibutable to noncontrolling interests Currency translation adjustment Other, net (41) 110 S 24,389 Balance, end of year Total Equity $ 12,030 S 17,548 (a) Includes total tax benefits of $107 million in 2015, $74 million in 2014 and $45 million in 2013