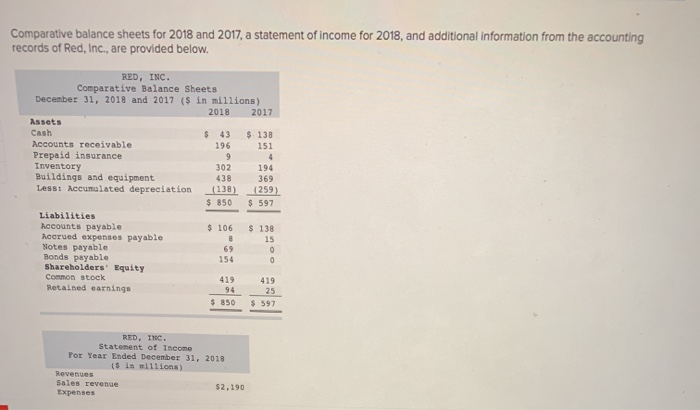
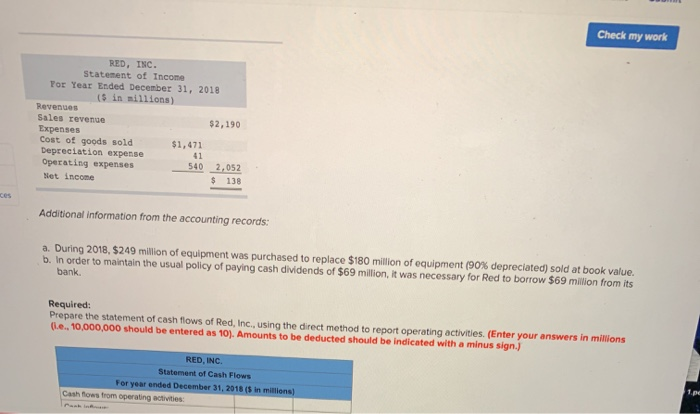
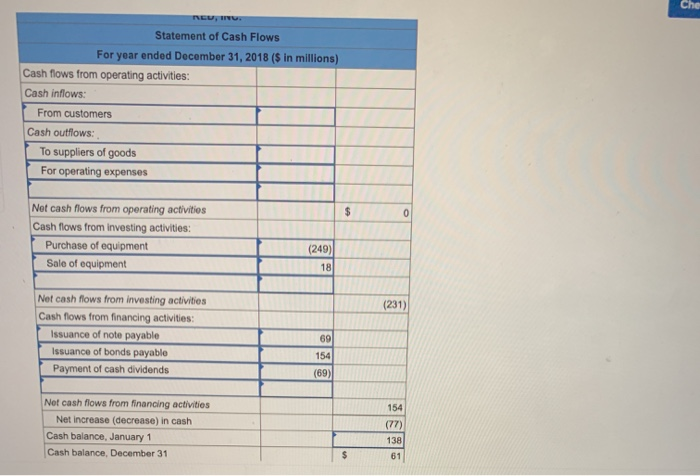
Comparative balance sheets for 2018 and 2017, a statement of income for 2018, and additional information from the accounting records of Red, Inc., are provided below. RED, INC. Comparative Balance Sheets December 31, 2018 and 2017 ($ in millions) 2018 2017 Assets Cash $ 43 $ 138 Accounts receivable 196 151 Prepaid insurance Inventory 302 194 Buildings and equipment 438 369 Less: Accumalated depreciation (138) (259) $ 850 597 Liabilities Accounts payable ACrued exenses payable Notes payable Bonds payable Shareholders' Equity $106 $138 15 69 154 C Common stock Retained earnings 419 419 94 25 850 $597 RED. INC. Statement of Income For Year Ended December 31, 2018 (S in millions) Revenues Sales revenue $2,190 Expenses Check my work RED, INC. Statement of Income For Year Ended December 31, 2018 (5 in millions) Revenues Sales revrenue Expenses Cost of goods sold Depreciation expense Operating expenses $2,190 $1,471 41 540 2,052 138 Net income ces Additional information from the accounting records: a. During 2018, $249 million of equipment was purchased to replace $180 million of equipment (90 % depreciated) sold at book value. b. In order to maintain the usual policy of paying cash dividends of $69 million, it was necessary for Red to borrow $69 million from its bank. Required: Prepare the statement of cash flows of Red, Inc., using the direct method to report operating activities. (Enter your answers in milions (Le, 10,000,000 should be entered as 10). Amounts to be deducted should be indicated with a minus sign.) RED, INC. Statement of Cash Flows 1 ee For year ended December 31, 2018 (S in millions) Cash fows from operating activities Pash in Che Statement of Cash Flows For year ended December 31, 2018 ($ in millions) Cash flows from operating activities: Cash inflows: From customers Cash outflows: To suppliers of goods For operating expenses Net cash flows from operating activities 0 Cash flows from investing activities: Purchase of equipment (249) Sale of equipment 18 Net cash flows from investing activities (231) Cash flows from financing activities: Issuance of note payable 69 Issuance of bonds payable 154 Payment of cash dividends (69) Net cash flows from financing activities 154 Net increase (decrease) in cash (77) Cash balance, January 1 138 Cash balance, December 31 61


