

Answered step by step
Verified Expert Solution
Question
1 Approved Answer
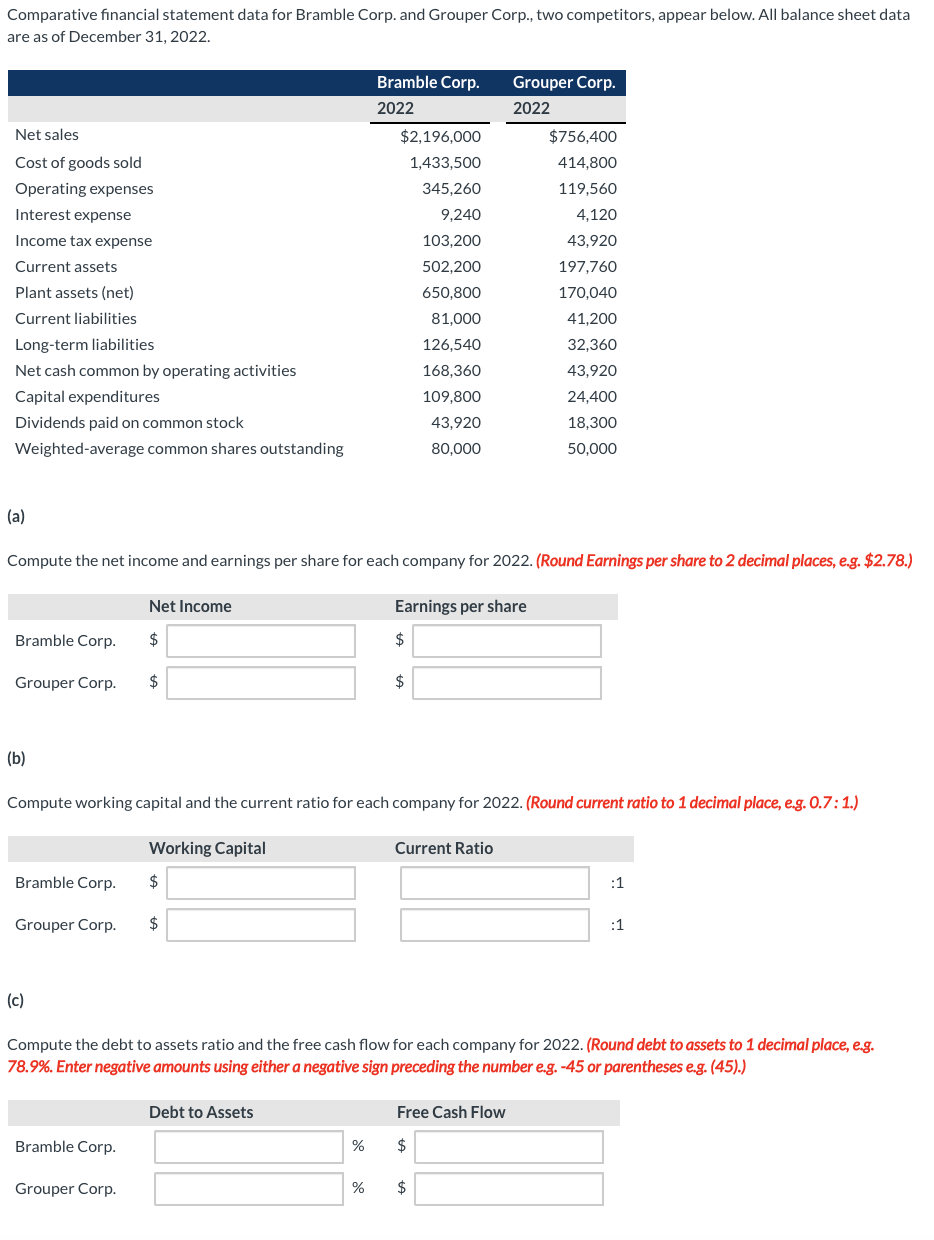
Comparative financial statement data for Bramble Corp. and Grouper Corp., two competitors, appear below. All balance sheet data are as of December 31, 2022. Grouper
Step by Step Solution
There are 3 Steps involved in it
Step: 1

Get Instant Access to Expert-Tailored Solutions
See step-by-step solutions with expert insights and AI powered tools for academic success
Step: 2

Step: 3
Ace Your Homework with AI
Get the answers you need in no time with our AI-driven, step-by-step assistance
Get Started
Essentials of Accounting for Governmental and Not-for-Profit Organizations
Authors: Paul A. Copley
10th Edition
007352705X, 978-0073527055