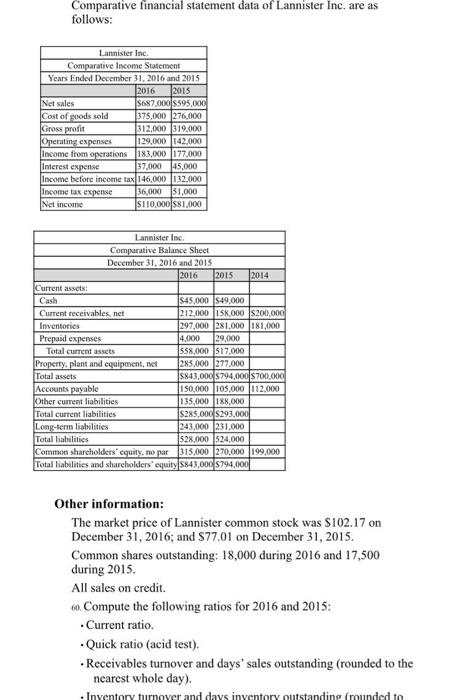
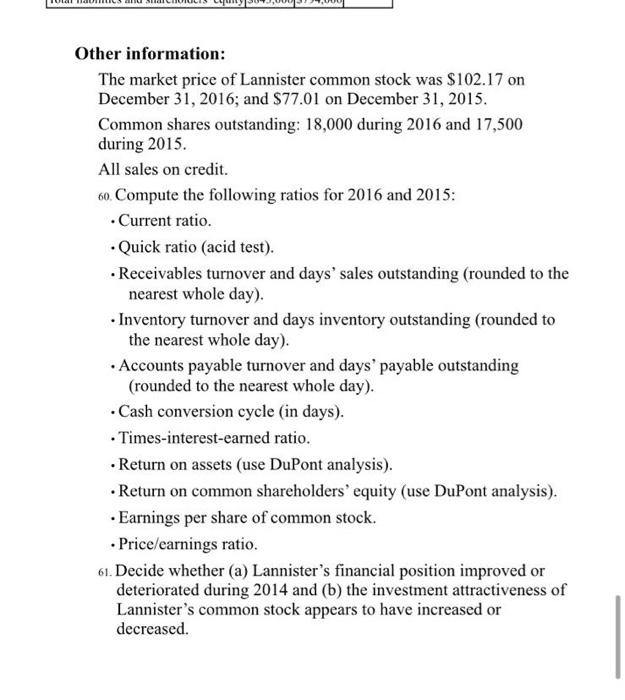
Comparative financial statement data of Lannister Inc. are as follows: Lannister Inc. Comparative Income Statement Years Ended December 31, 2016 and 2015 2016 2015 Net sales SA87.000 8595,000 Cost of goods sold 375,000 276,000 Gross profit 312.000 319,000 Operating expenses 129.000 142.000 Income from operations 183,000 (177.000 Interest expense 37,000 45,000 Income before income tax 146,000 132.000 Income tax expense 36,000 $1,000 Net income $110,000 $81.000 Lannister Inc. Comparative Balance Sheet December 31, 2016 and 2015 2016 2015 2014 Current assets: Cash $45,000 $49.000 Current receivables.net 212,000 158,000 $200,000 Inventories 297.000 281.000 181,000 Prepaid expenses 4,000 29,000 Total current assets 558,000 $17,000 Property, plant and equipment, net 285,000 277.000 Total assets 5843,000 $794,000 $700.000 Accounts payable 150.000 105.000 112.000 Other current liabilities 135,000 188.000 Total current liabilities $285,000 $293.000 Long-term liabilities 243.000 231.000 Total liabilities 528,000 524.000 Common shareholders' equity, no par 315,000 270,000 199,000 Total liabilities and shareholders equitys843,0005794,000 Other information: The market price of Lannister common stock was $102.17 on December 31, 2016; and S77.01 on December 31, 2015. Common shares outstanding: 18,000 during 2016 and 17,500 during 2015, All sales on credit. 60. Compute the following ratios for 2016 and 2015: . Current ratio. Quick ratio (acid test). Receivables turnover and days' sales outstanding (rounded to the nearest whole day). Inventory turnover and days inventory outstanding (rounded to Other information: The market price of Lannister common stock was $102.17 on December 31, 2016; and $77.01 on December 31, 2015. Common shares outstanding: 18,000 during 2016 and 17,500 during 2015. All sales on credit. 60 Compute the following ratios for 2016 and 2015: Current ratio. - Quick ratio (acid test). Receivables turnover and days' sales outstanding (rounded to the nearest whole day). Inventory turnover and days inventory outstanding (rounded to the nearest whole day). Accounts payable turnover and days' payable outstanding (rounded to the nearest whole day). - Cash conversion cycle (in days). Times-interest-earned ratio. Return on assets (use DuPont analysis). Return on common shareholders' equity (use DuPont analysis). Earnings per share of common stock. Price/earnings ratio. 61. Decide whether (a) Lannister's financial position improved or deteriorated during 2014 and (b) the investment attractiveness of Lannister's common stock appears to have increased or decreased