

Answered step by step
Verified Expert Solution
Question
1 Approved Answer
Comparative financial statements for Heritage Antiquing Services for the fiscal year ending December 31 appear on the following page. The company did not issue any
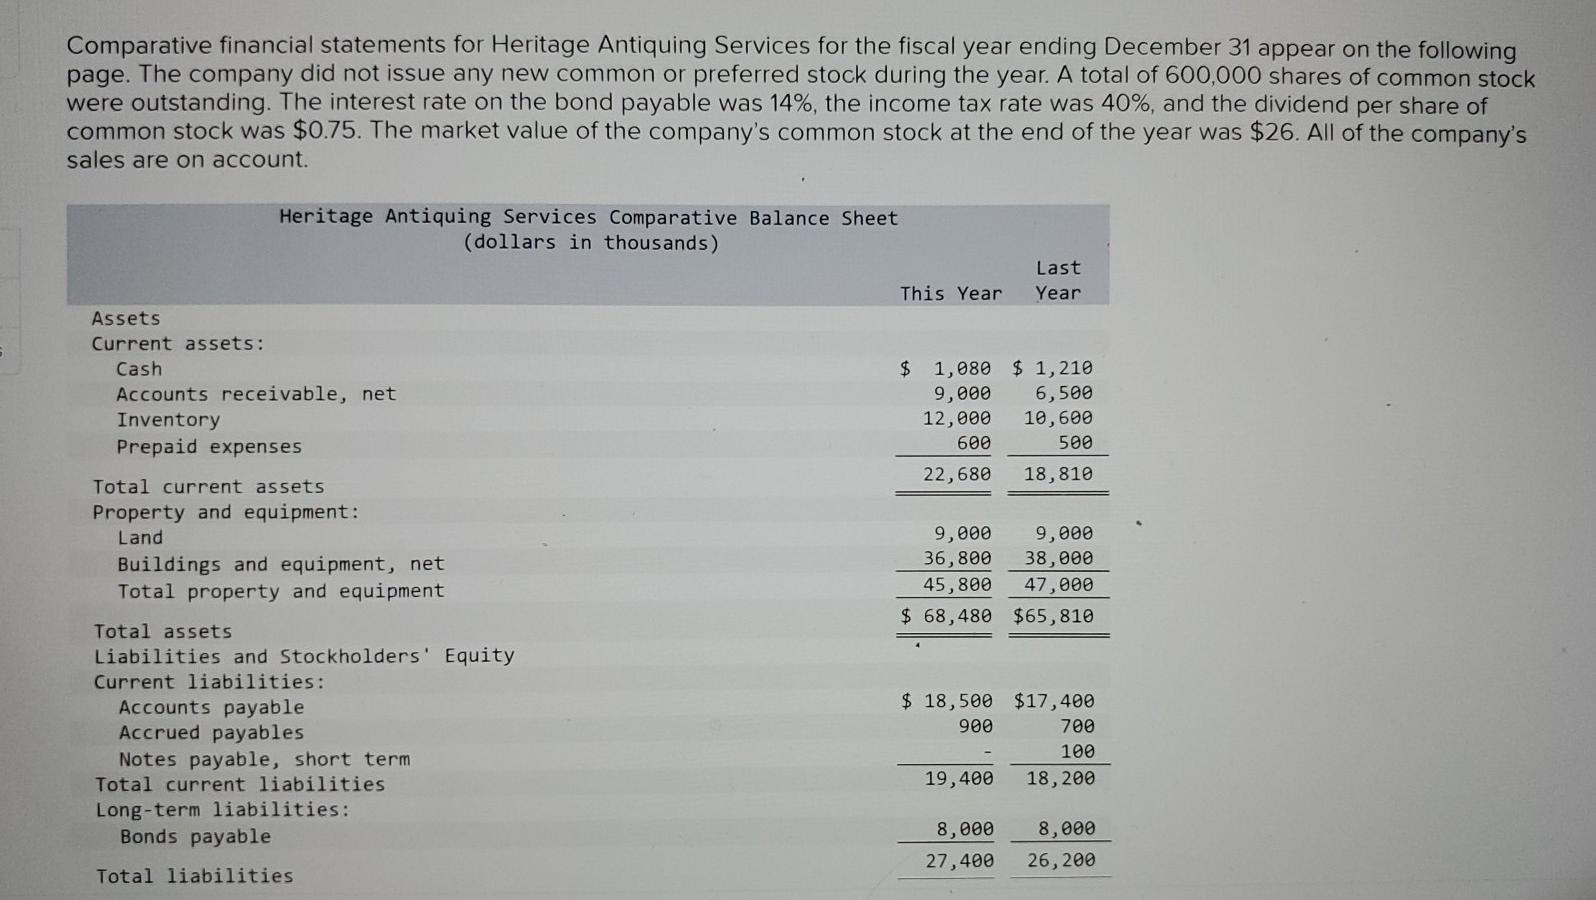
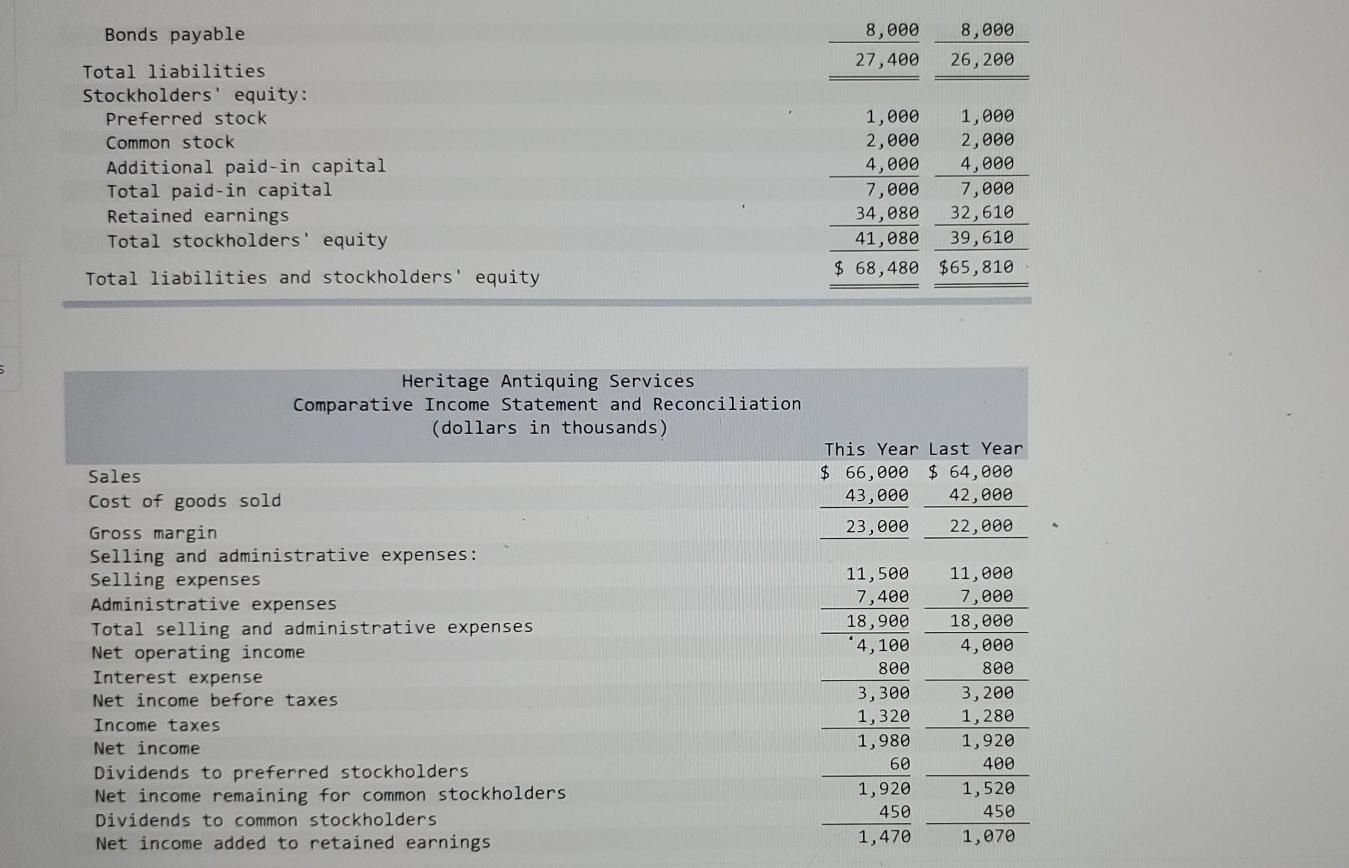
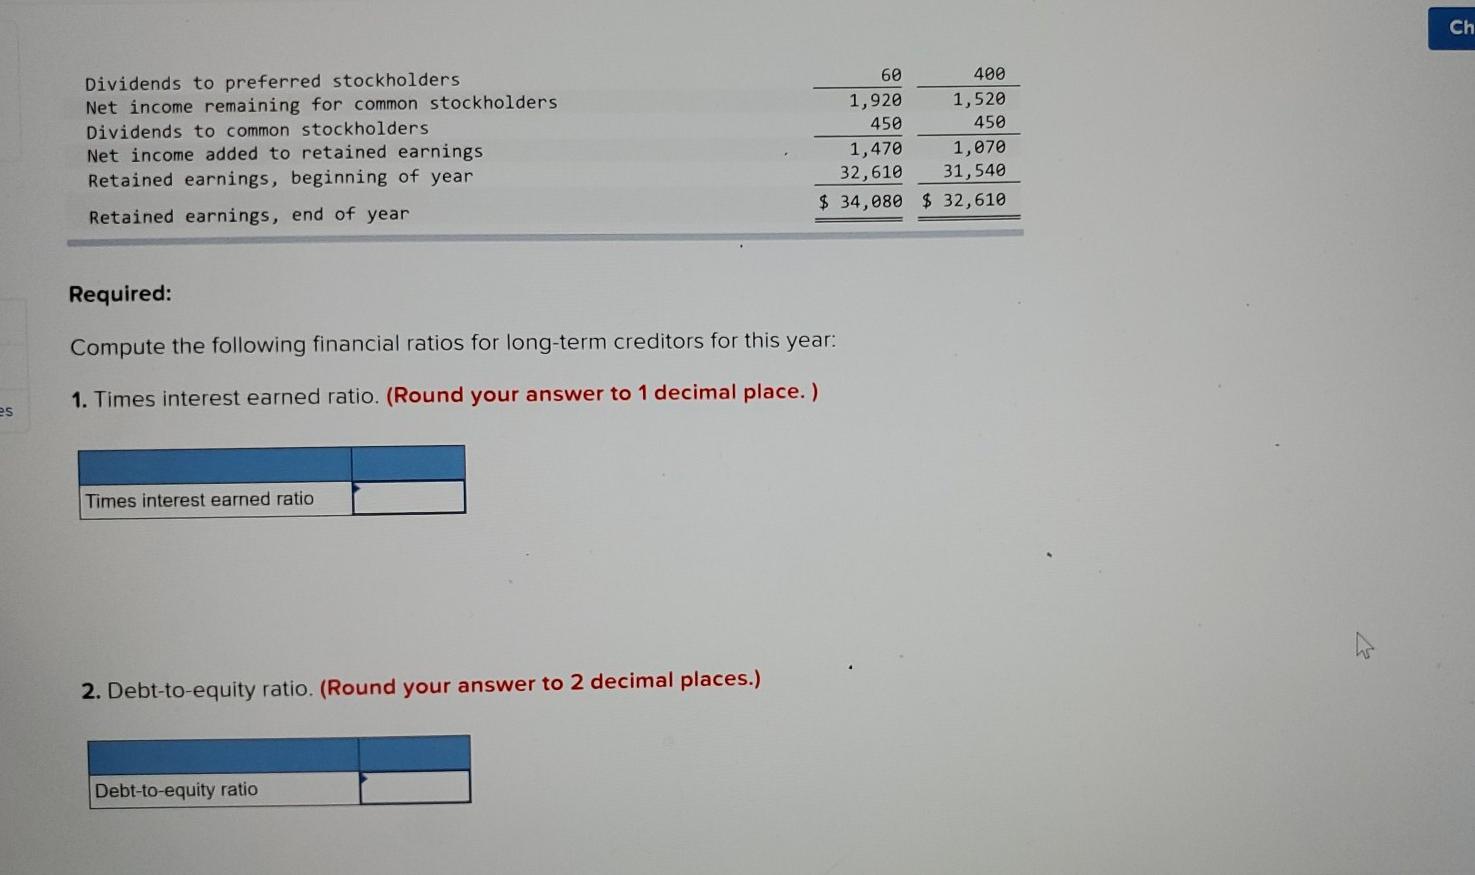
Comparative financial statements for Heritage Antiquing Services for the fiscal year ending December 31 appear on the following page. The company did not issue any new common or preferred stock during the year. A total of 600,000 shares of common stock were outstanding. The interest rate on the bond payable was 14%, the income tax rate was 40%, and the dividend per share of common stock was $0.75. The market value of the company's common stock at the end of the year was $26. All of the company's sales are on account. Heritage Antiquing Services Comparative Balance Sheet (dollars in thousands) Last Year This Year Assets Current assets: Cash Accounts receivable, net Inventory Prepaid expenses Total current assets Property and equipment: Land Buildings and equipment, net Total property and equipment $ 1,080 $ 1,210 9,000 6,500 12,000 10,600 600 500 22,680 18,810 9,000 9,000 36,800 38,000 45,800 47,000 $ 68,480 $65,810 Total assets Liabilities and Stockholders' Equity Current liabilities: Accounts payable Accrued payables Notes payable, short term Total current liabilities Long-term liabilities: Bonds payable $ 18,500 $17,400 900 700 100 19,400 18, 200 8,000 27,400 8,000 26,200 Total liabilities 8,000 27,400 8,000 26, 200 Bonds payable Total liabilities Stockholders' equity: Preferred stock Common stock Additional paid-in capital Total paid-in capital Retained earnings Total stockholders' equity Total liabilities and stockholders' equity 1,000 1,000 2,000 2,000 4,000 4,000 7,000 7,000 34,080 32,610 41,080 39,610 $ 68,480 $65,810 Heritage Antiquing Services Comparative Income Statement and Reconciliation (dollars in thousands) This Year Last Year $ 66,000 $ 64,000 43,000 42,000 23,000 22,000 Sales Cost of goods sold Gross margin Selling and administrative expenses: Selling expenses Administrative expenses Total selling and administrative expenses Net operating income Interest expense Net income before taxes Income taxes Net income Dividends to preferred stockholders Net income remaining for common stockholders Dividends to common stockholders Net income added to retained earnings 11,500 7,400 18,900 *4,100 800 3,300 1,320 1,980 60 1,920 450 1,470 11,000 7,000 18,000 4,000 800 3,200 1,280 1,920 400 1,520 450 1,070 Ch Dividends to preferred stockholders Net income remaining for common stockholders Dividends to common stockholders Net income added to retained earnings Retained earnings, beginning of year Retained earnings, end of year 60 400 1,920 1,520 450 450 1,470 1,070 32,610 31,540 $ 34,080 $ 32,610 Required: Compute the following financial ratios for long-term creditors for this year: 1. Times interest earned ratio. (Round your answer to 1 decimal place.) es Times interest earned ratio 2. Debt-to-equity ratio. (Round your answer to 2 decimal places.) Debt-to-equity ratio
Step by Step Solution
There are 3 Steps involved in it
Step: 1

Get Instant Access to Expert-Tailored Solutions
See step-by-step solutions with expert insights and AI powered tools for academic success
Step: 2

Step: 3
Ace Your Homework with AI
Get the answers you need in no time with our AI-driven, step-by-step assistance
Get Started
Finance Online Case Library
Authors: Eugene F. Brigham
1st Edition
0324275218, 9780324275216