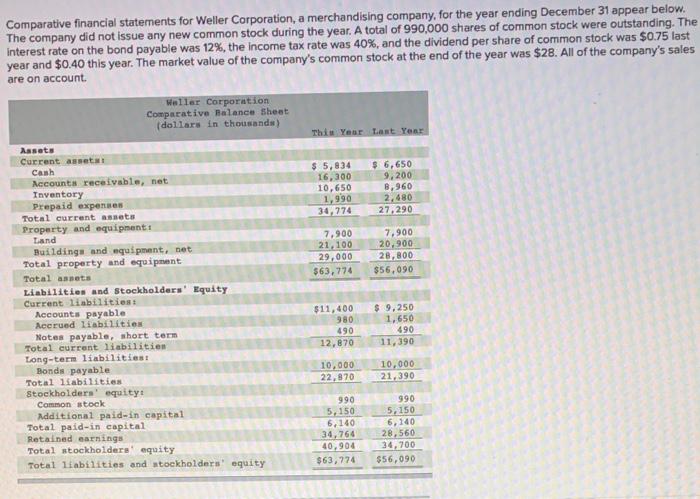
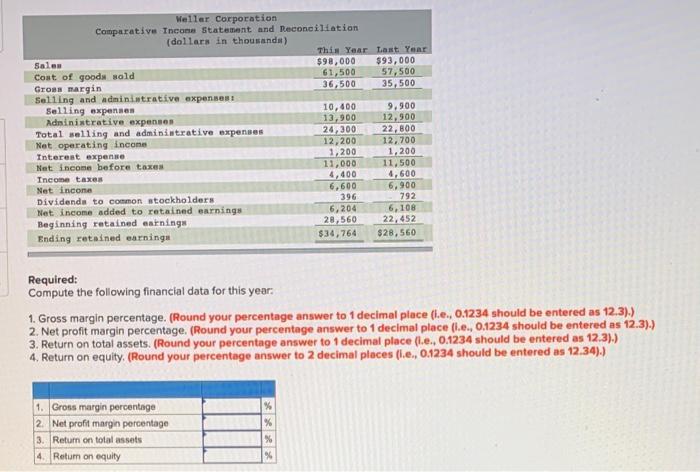
Comparative financial statements for Weller Corporation, a merchandising company, for the year ending December 31 appear below. The company did not issue any new common stock during the year. A total of 990,000 shares of common stock were outstanding. The Interest rate on the bond payable was 12%, the income tax rate was 40%, and the dividend per share of common stock was $0.75 last year and $0.40 this year. The market value of the company's common stock at the end of the year was $28. All of the company's sales are on account woller Corporation Comparative Balance sheet dollars in thousands) This Your Last Year Assets Current assets Cash Accounts receivable, net Inventory Prepaid expenses Total current assets Property and equipment: Land Buildings and equipment, net Total property and equipment $ 5,834 16,300 10,650 1,990 34,774 $ 6,650 9,200 8,960 2,480 27,290 7.900 21,100 29,000 $63,774 7.900 20.900 28,800 $56,090 Total assets $11,400 380 490 12,870 $ 9.250 1,650 490 11,390 Liabilities and Stockholders' Equity Current liabilities: Accounts payable Accrued liabilities Notes payable, short term Total current liabilities Long-term liabilities Bonds payable Total liabilities Stockholders' equity: Common stock Additional paid-in capital Total paid-in capital Retained earnings Total stockholders' equity Total liabilities and stockholders' equity 10,000 22,870 10,000 21,390 990 5,150 6.140 34,764 40,904 $63,774 990 5,150 6,140 28,560 34,700 $56,090 Wellar Corporation Comparative Income Statement and Reconciliation (dollars in thousands) This Year Last Year $98,000 61,500 36,500 $93,000 57,500 35,500 Sales Cost of goods sold Gross margin Selling and administrative expenses Selling expensen Administrative expenses Total selling and administrative expenses Net operating income Interest expense Net Income before taxes Income taxes Net income Dividends to common stockholders Net income added to retained earnings Beginning retained earnings Ending retained earningu 10,400 13,900 24,300 12,200 1,200 11,000 4,400 6,600 396 6,204 28,560 $34, 764 9,900 12,900 22,800 12,700 1,200 11,500 4,600 6.900 792 6,108 22,452 $28,560 Required: Compute the following financial data for this year. 1. Gross margin percentage. (Round your percentage answer to 1 decimal place (i.e., 0.1234 should be entered as 12.3).) 2. Net profit margin percentage. (Round your percentage answer to 1 decimal place (.e., 0.1234 should be entered as 12.3).) 3. Return on total assets. (Round your percentage answer to 1 decimal place (lie., 0.1234 should be entered as 12,3).) 4. Return on equity (Round your percentage answer to 2 decimal places i.e., 01234 should be entered as 12.34).) % 1. Gross margin percentage 2. Net profit margin percentage % 3. Return on total assets % 4. Return on equity 94