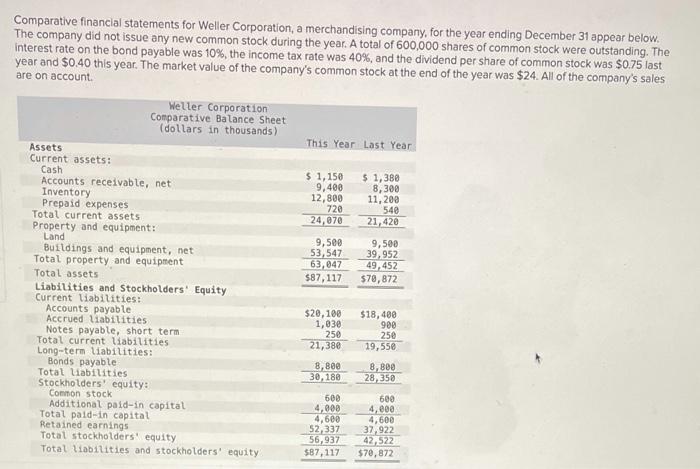
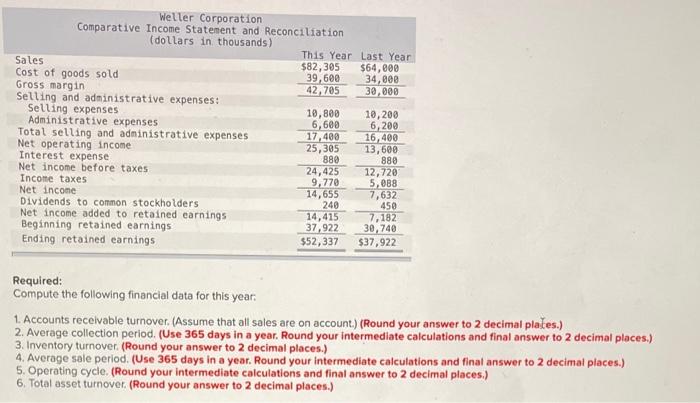
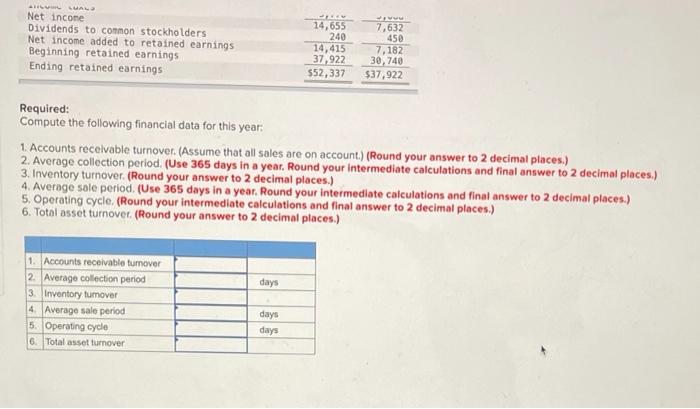
Comparative financial statements for Weller Corporation, a merchandising company, for the year ending December 31 appear below. The company did not issue any new common stock during the year. A total of 600,000 shares of common stock were outstanding. The interest rate on the bond payable was 10%, the income tax rate was 40%, and the dividend per share of common stock was $0.75 last year and $0.40 this year. The market value of the company's common stock at the end of the year was $24. All of the company's sales are on account Weller Corporation Comparative Balance Sheet (dollars in thousands) This Year Last Year Assets Current assets: Cash $ 1,150 Accounts receivable, net $ 1,380 9,400 8,300 Inventory 12,800 11,200 Prepaid expenses 720 540 Total current assets 24,070 21,420 Property and equipment: Land 9,500 9,500 Buildings and equipment, net 53,547 39,952 Total property and equipment 63,047 49,452 Total assets $87, 117 $78,872 Liabilities and Stockholders' Equity Current liabilities: Accounts payable $20,100 $18,400 Accrued liabilities 1,830 900 Notes payable, short term 250 250 Total current liabilities 21,380 19,550 Long-term Liabilities: Bonds payable 8,800 8,800 Total Liabilities 30, 180 28,350 Stockholders' equity: Common stock 600 600 Additional paid-in capital 4,000 4,000 Total pald-in capital 4,600 4,600 Retained earnings 52,337 37,922 Total stockholders' equity 56,937 42,522 Total liabilities and stockholders' equity $87,117 $70, 872 Weller Corporation Comparative Income Statement and Reconciliation (dollars in thousands) This Year Last Year Sales $82,305 $64,000 Cost of goods sold 39,600 34,000 Gross margin 42,705 30,000 Selling and administrative expenses: Selling expenses 10,800 10,200 Administrative expenses 6,600 6,200 Total selling and administrative expenses 17,400 16,400 Net operating income 25,305 13,600 Interest expense 889 880 Net income before taxes 24,425 12,720 Income taxes 9,770 5,088 Net income 14,655 7,632 Dividends to common stockholders 240 450 Net income added to retained earnings 14,415 7,182 Beginning retained earnings 37,922 30,740 Ending retained earnings $52,337 $37,922 Required: Compute the following financial data for this year, 1. Accounts receivable turnover. (Assume that all sales are on account.) (Round your answer to 2 decimal plates.) 2. Average collection period. (Use 365 days in a year. Round your intermediate calculations and final answer to 2 decimal places.) 3. Inventory turnover (Round your answer to 2 decimal places.) 4. Average sole period. (Use 365 days in a year. Round your intermediate calculations and final answer to 2 decimal places.) 5. Operating cycle. (Round your intermediate calculations and final answer to 2 decimal places.) 6. Total asset turnover (Round your answer to 2 decimal places.) ILLUA Net income Dividends to common stockholders Net income added to retained earnings Beginning retained earnings Ending retained earnings 14,655 240 14,415 37,922 $52,337 7,632 450 7,182 30,740 $37,922 Required: Compute the following financial data for this year. 1. Accounts receivable turnover. (Assume that all sales are on account.) (Round your answer to 2 decimal places.) 2. Average collection period. (Use 365 days in a year. Round your intermediate calculations and final answer to 2 decimal places.) 3. Inventory turnover (Round your answer to 2 decimal places.) 4. Average sale period. (Use 365 days in a year. Round your intermediate calculations and final answer to 2 decimal places.) 5. Operating cycle. (Round your intermediate calculations and final answer to 2 decimal places.) 6. Total asset turnover (Round your answer to 2 decimal places.) days 1. Accounts receivable tumover 2. Average collection period 3. Inventory tumover 4 Average sale period 5. Operating cycle 6. Total asset turnover days days