

Answered step by step
Verified Expert Solution
Question
1 Approved Answer
Comparative financial statements for Weller Corporation, a merchandising company, for the year ending December 31 appear below. The company did not issue any new common
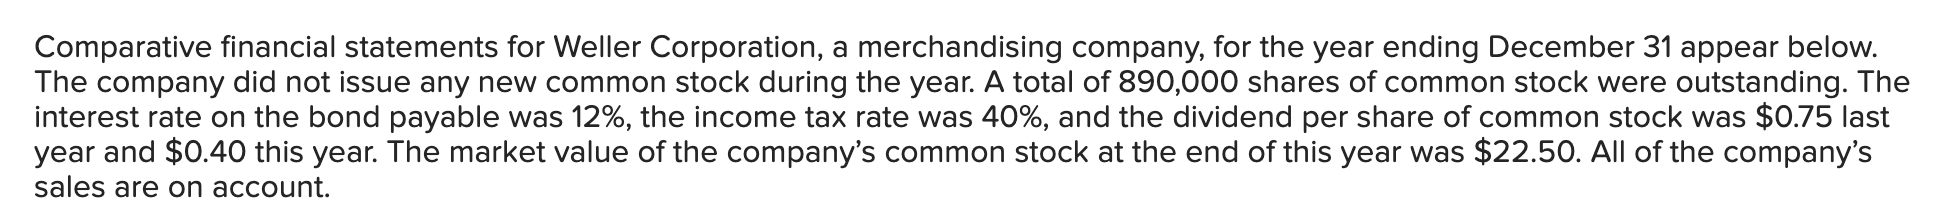
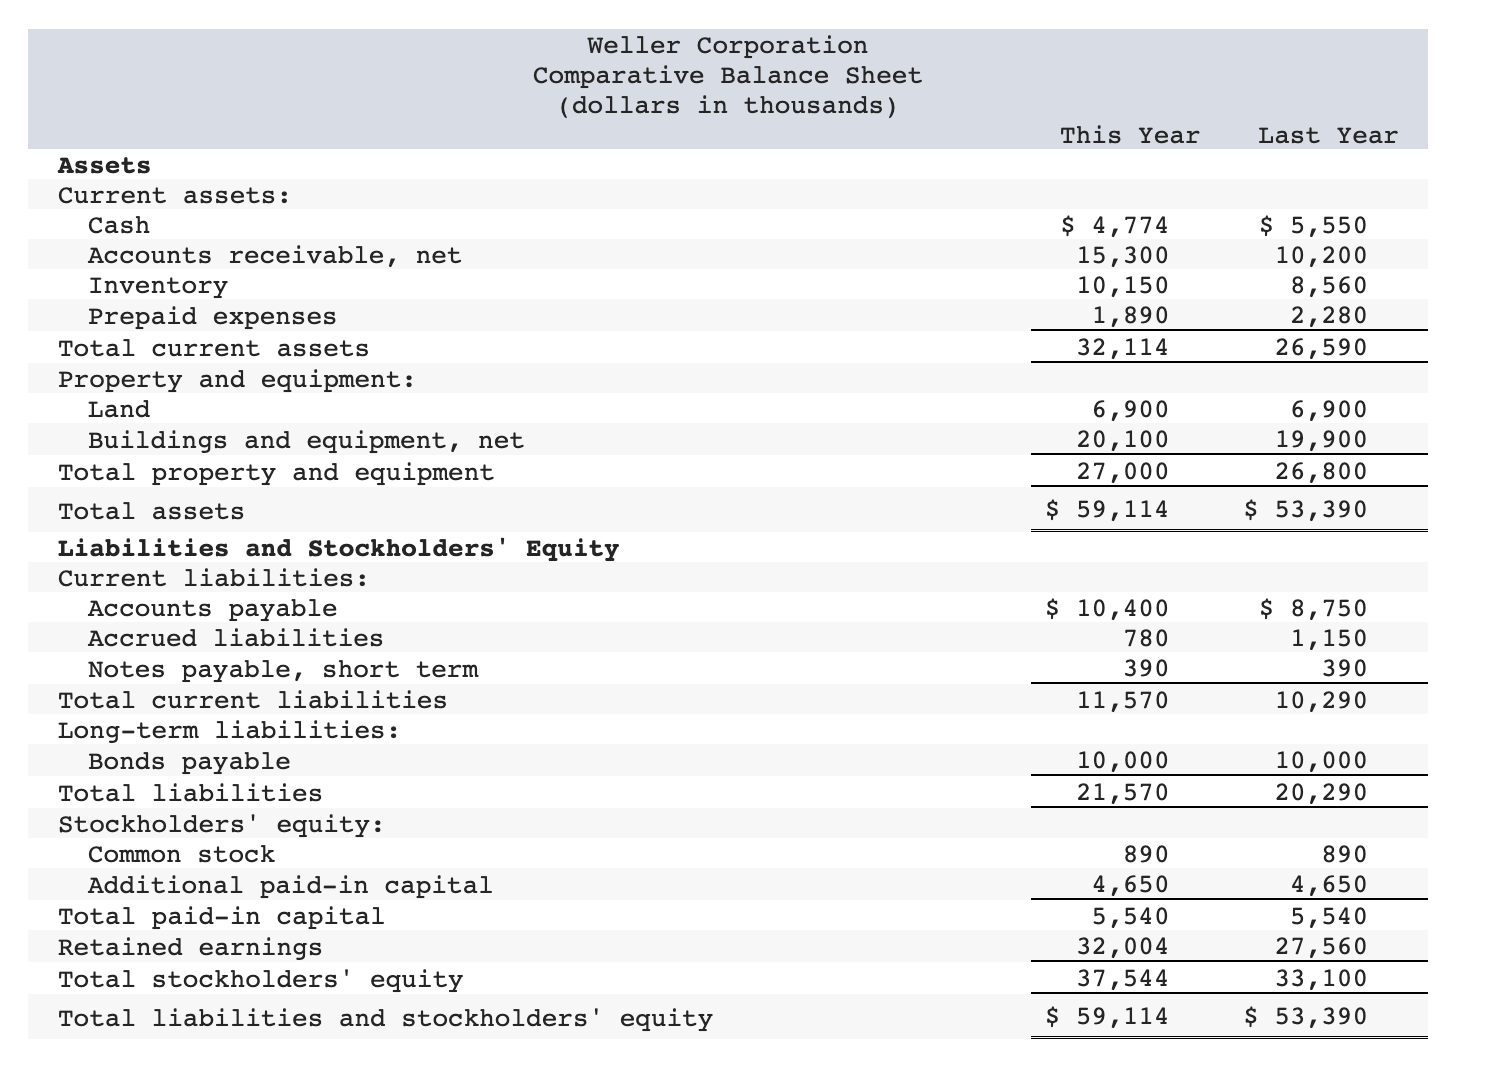
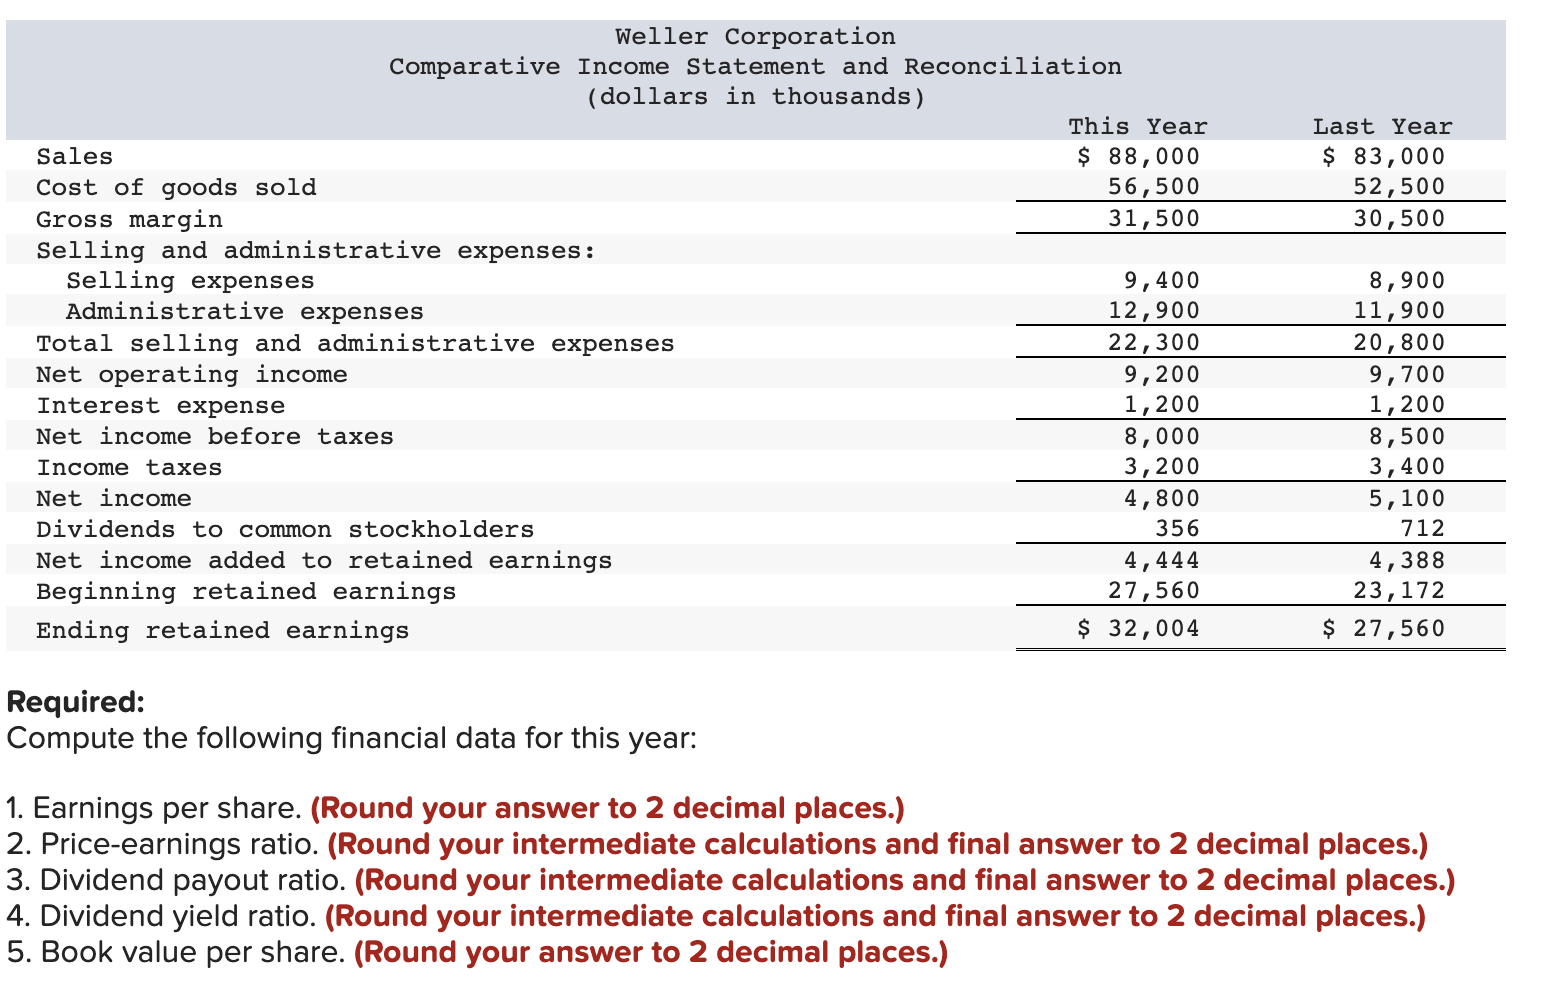
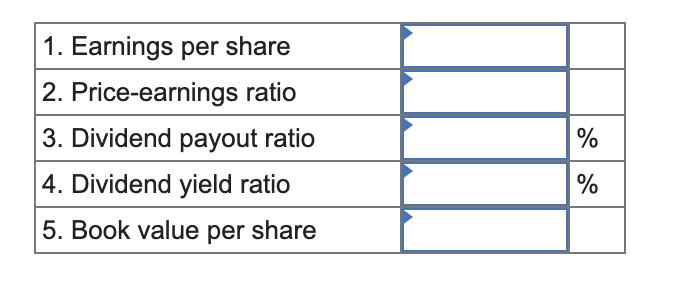
Comparative financial statements for Weller Corporation, a merchandising company, for the year ending December 31 appear below. The company did not issue any new common stock during the year. A total of 890,000 shares of common stock were outstanding. The interest rate on the bond payable was 12%, the income tax rate was 40%, and the dividend per share of common stock was $0.75 last year and $0.40 this year. The market value of the company's common stock at the end of this year was $22.50. All of the company's sales are on account. Weller Corporation Comparative Balance Sheet (dollars in thousands) This Year Last Year Assets Current assets: Cash Accounts receivable, net Inventory Prepaid expenses Total current assets Property and equipment: Land Buildings and equipment, net Total property and equipment Total assets Liabilities and Stockholders' Equity Current liabilities: Accounts payable Accrued liabilities Notes payable, short term Total current liabilities Long-term liabilities: Bonds payable Total liabilities Stockholders' equity: Common stock Additional paid-in capital Total paid-in capital Retained earnings Total stockholders' equity Total liabilities and stockholders' equity \begin{tabular}{rr} $4,774 & $5,550 \\ 15,300 & 10,200 \\ 10,150 & 8,560 \\ 1,890 & 2,280 \\ \hline 32,114 & 26,590 \\ \hline & \\ 6,900 & 6,900 \\ 20,100 & 19,900 \\ \hline 27,000 & 26,800 \\ \hline$59,114 & $53,390 \\ \hline \end{tabular} \begin{tabular}{rr} $10,400 & $8,750 \\ 780 & 1,150 \\ 390 & 390 \\ \hline 11,570 & 10,290 \\ 10,000 & 10,000 \\ \hline 21,570 & 20,290 \\ \hline \end{tabular} \begin{tabular}{rr} 890 & 890 \\ 4,650 & 4,650 \\ \hline 5,540 & 5,540 \\ 32,004 & 27,560 \\ \hline 37,544 & 33,100 \\ \hline$59,114 & $53,390 \\ \hline \end{tabular} Required: Compute the following financial data for this year: 1. Earnings per share. (Round your answer to 2 decimal places.) 2. Price-earnings ratio. (Round your intermediate calculations and final answer to 2 decimal places.) 3. Dividend payout ratio. (Round your intermediate calculations and final answer to 2 decimal places.) 4. Dividend yield ratio. (Round your intermediate calculations and final answer to 2 decimal places.) 5. Book value per share. (Round your answer to 2 decimal places.) \begin{tabular}{|l|l|l|} \hline 1. Earnings per share & & \\ \hline 2. Price-earnings ratio & & \\ \hline 3. Dividend payout ratio & & % \\ \hline 4. Dividend yield ratio & & % \\ \hline 5. Book value per share & & \\ \hline \end{tabular}
Step by Step Solution
There are 3 Steps involved in it
Step: 1

Get Instant Access to Expert-Tailored Solutions
See step-by-step solutions with expert insights and AI powered tools for academic success
Step: 2

Step: 3
Ace Your Homework with AI
Get the answers you need in no time with our AI-driven, step-by-step assistance
Get Started
Managerial Accounting Special Edition For California State University Los Angeles
Authors: Garrison
14th Edition
0077519973, 978-0077519971