

Answered step by step
Verified Expert Solution
Question
1 Approved Answer
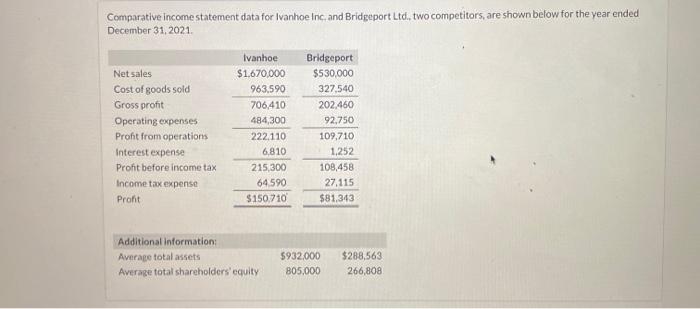
Comparative Income statement data for Ivanhoe Inc and Bridgeport Ltd, two competitors are shown below for the year ended December 31, 2021 Net sales Cost
Step by Step Solution
There are 3 Steps involved in it
Step: 1

Get Instant Access to Expert-Tailored Solutions
See step-by-step solutions with expert insights and AI powered tools for academic success
Step: 2

Step: 3
Ace Your Homework with AI
Get the answers you need in no time with our AI-driven, step-by-step assistance
Get Started
College Accounting A Practical Approach Chapters 1-25
Authors: Jeffrey Slater, Mike Deschamps
15th Edition
0137504284, 9780137504282