Answered step by step
Verified Expert Solution
Question
1 Approved Answer
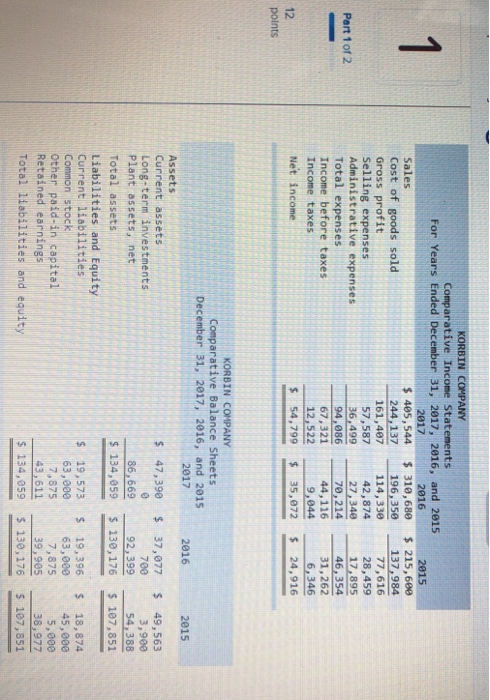
Comparative Income Statements For Years Ended December 31, 2017, 2016, and 2915 2017 2916 2015 Sales $ 405,544 310,680 215,660 196,350137,984 Cost of goods sold
Step by Step Solution
There are 3 Steps involved in it
Step: 1

Get Instant Access to Expert-Tailored Solutions
See step-by-step solutions with expert insights and AI powered tools for academic success
Step: 2

Step: 3
Ace Your Homework with AI
Get the answers you need in no time with our AI-driven, step-by-step assistance
Get Started