

Answered step by step
Verified Expert Solution
Question
1 Approved Answer
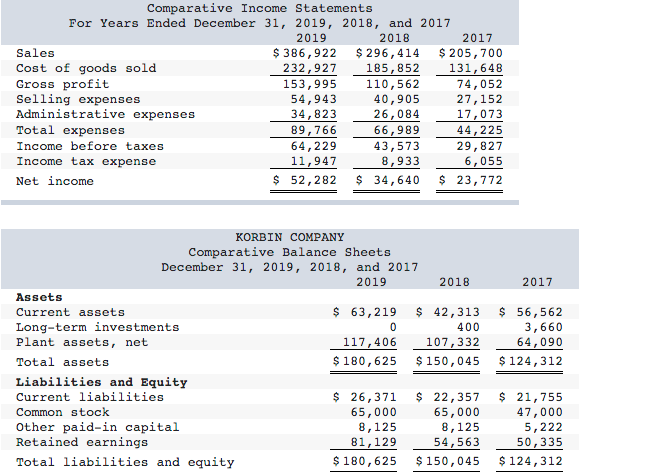
Comparative Income Statements For Years Ended December 31, 2019, 2018, and 2017 2019 2018 2017 Sales $ 386,922 $ 296,414 $ 205,700 Cost of goods
Step by Step Solution
There are 3 Steps involved in it
Step: 1

Get Instant Access to Expert-Tailored Solutions
See step-by-step solutions with expert insights and AI powered tools for academic success
Step: 2

Step: 3
Ace Your Homework with AI
Get the answers you need in no time with our AI-driven, step-by-step assistance
Get Started
Financial Statements The Ultimate Guide To Financial Statements Analysis For Business Owners And Investors
Authors: Greg Shields
1st Edition
172643320X, 978-1726433204