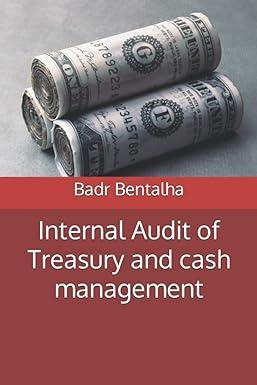
Compare Anandam's financial ratios relative to industry ratios. What story do the ratios say about the company?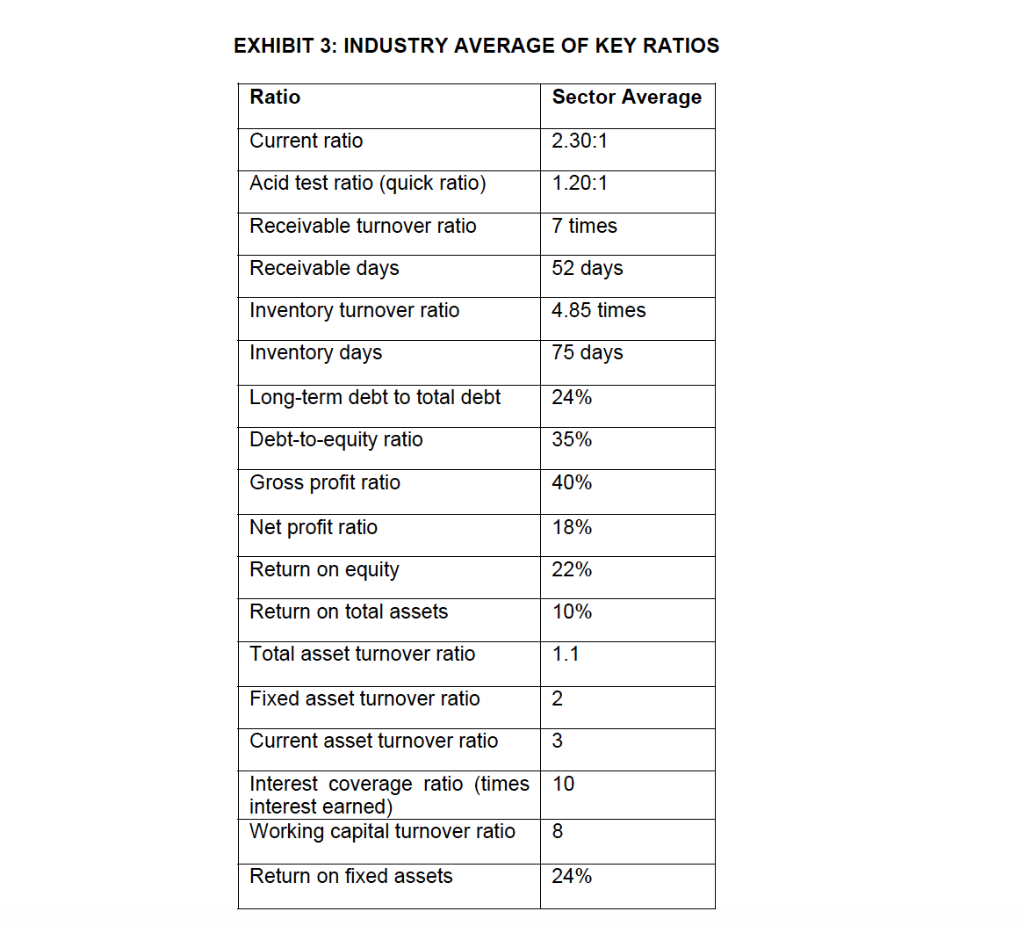
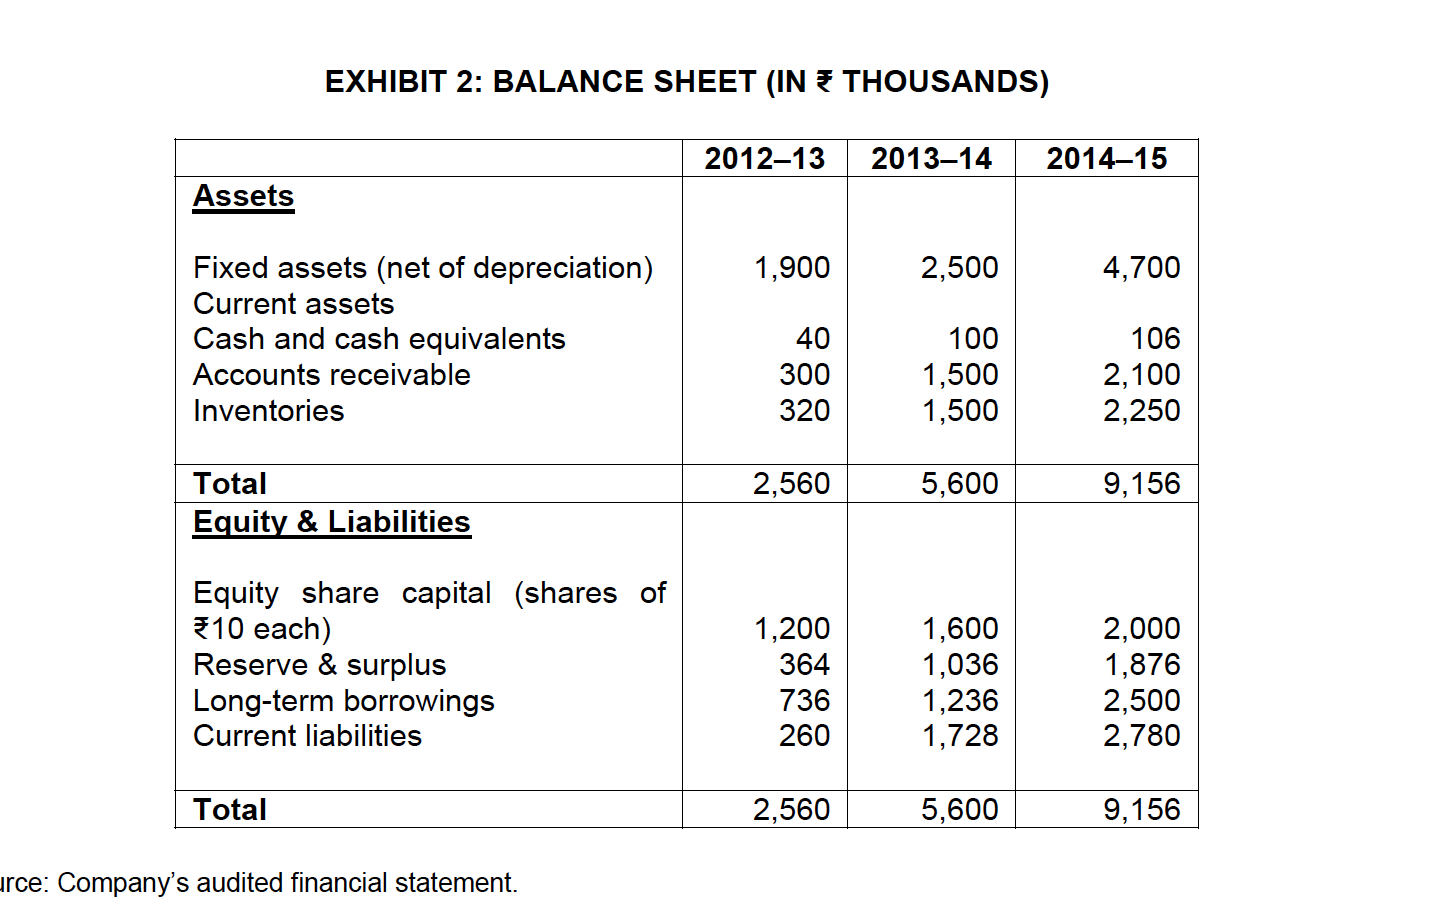
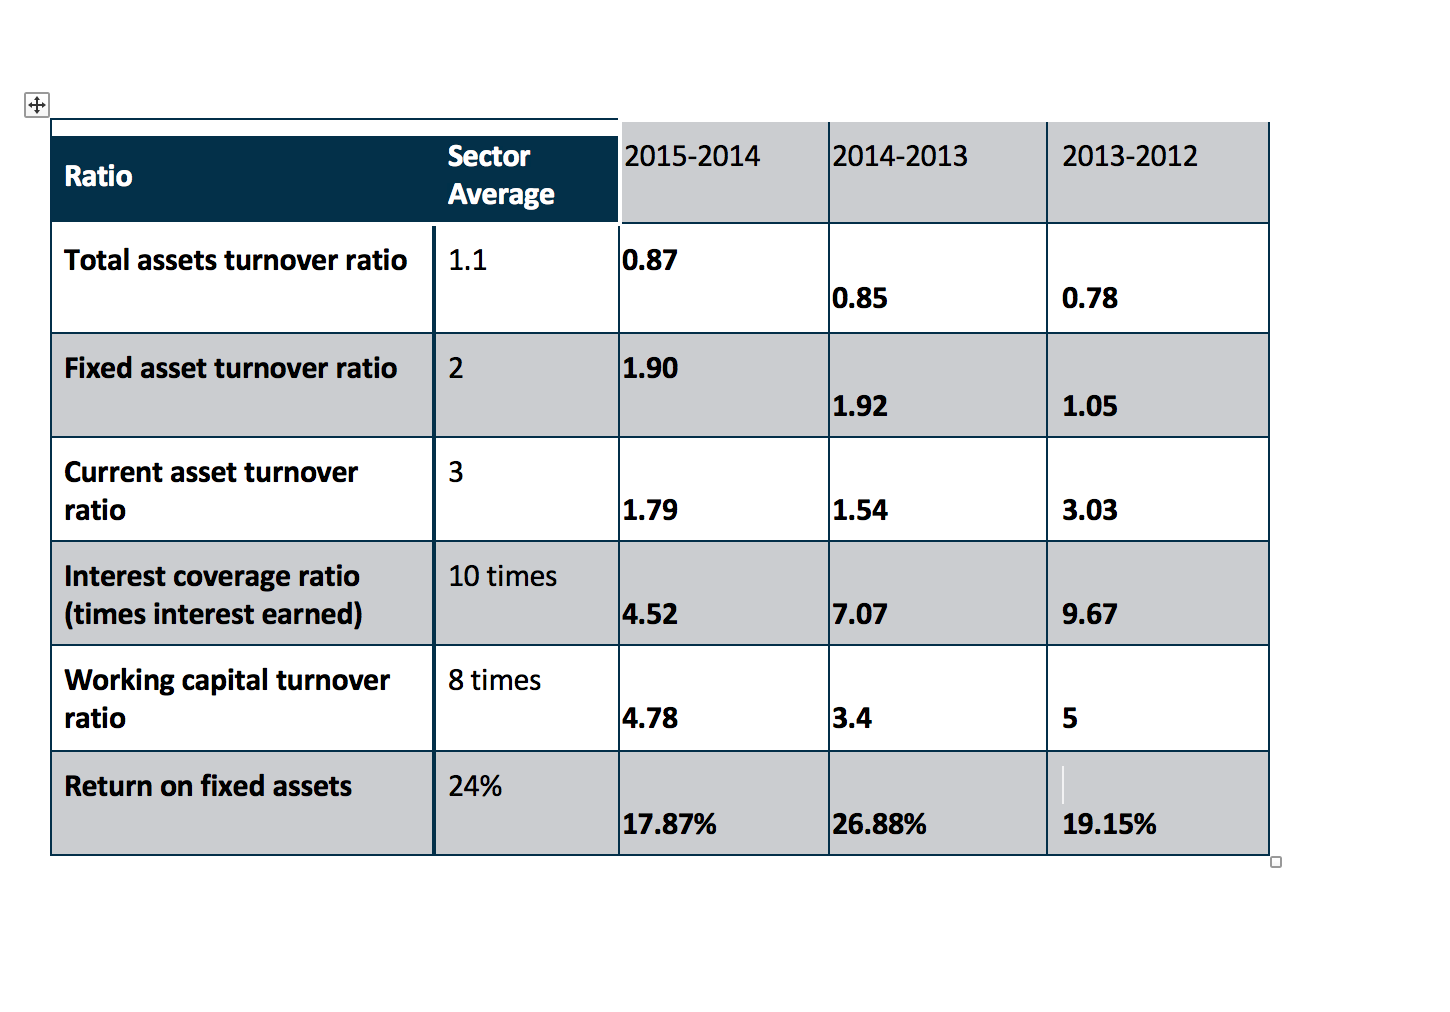
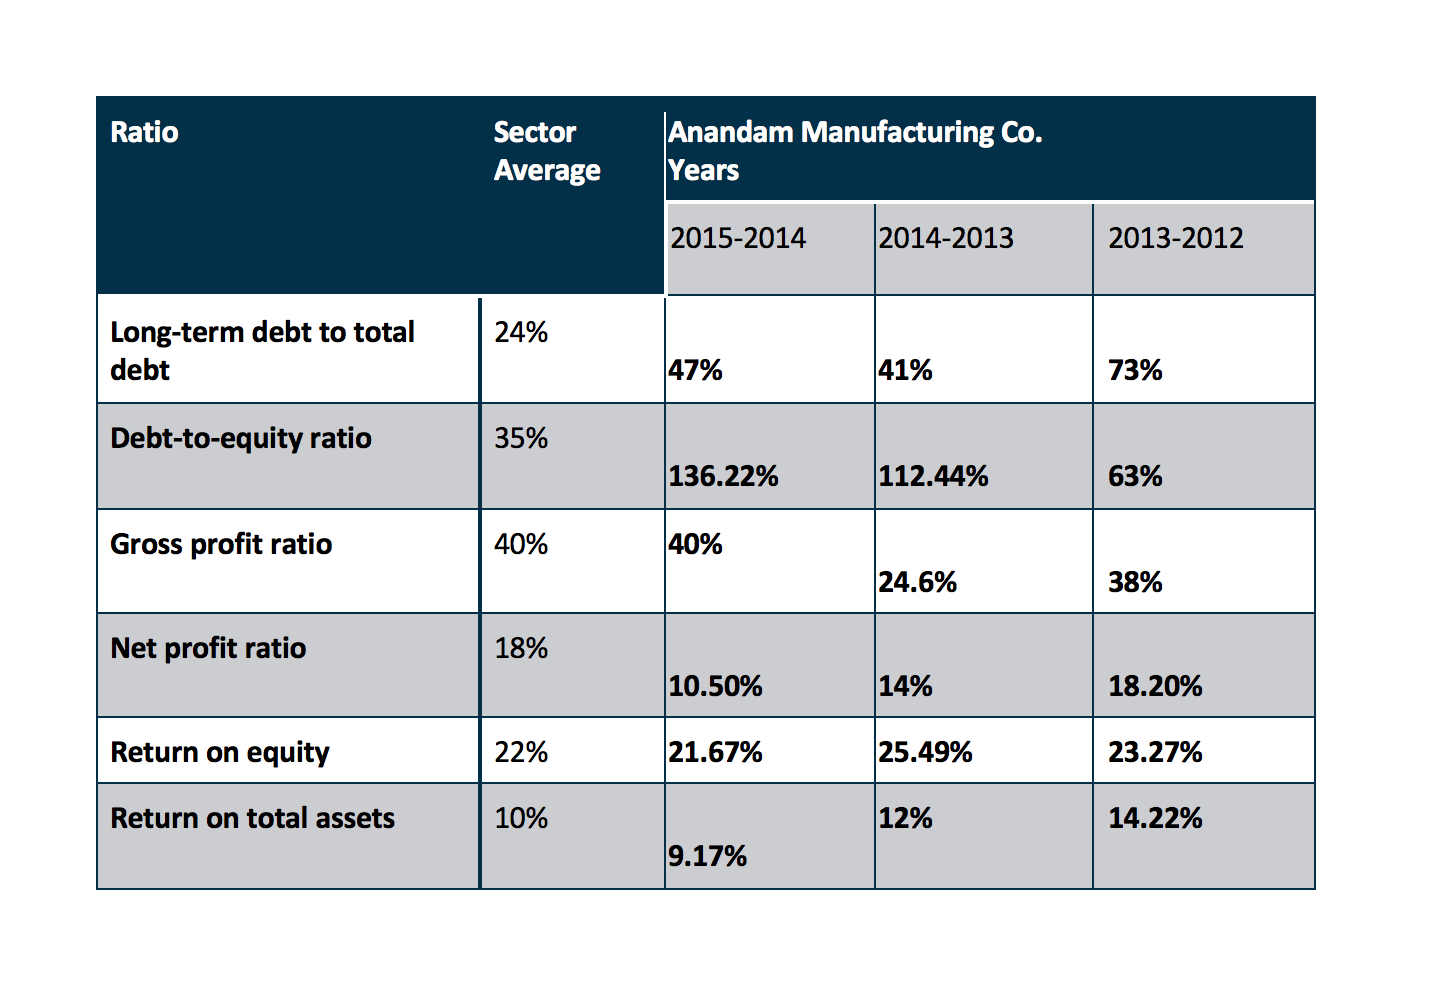
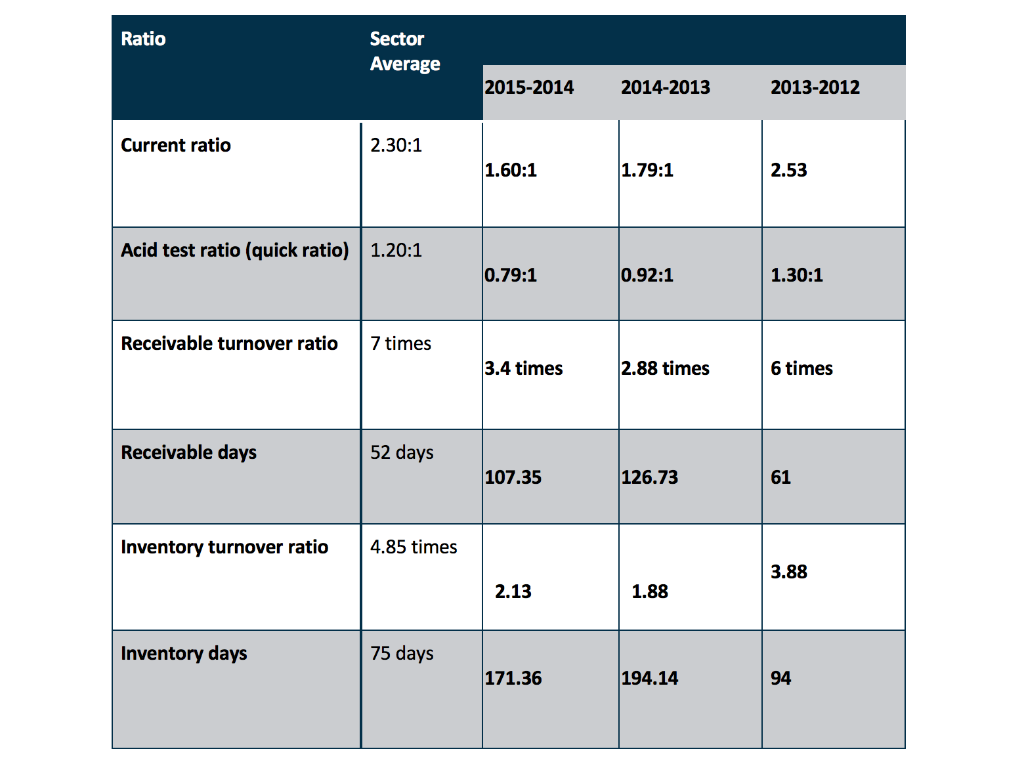
EXHIBIT 3: INDUSTRY AVERAGE OF KEY RATIOS Ratio Sector Average Current ratio 2.30:1 Acid test ratio (quick ratio) 1.20:1 Receivable turnover ratio 7 times Receivable days 52 days Inventory turnover ratio 4.85 times Inventory days 75 days Long-term debt to total debt 24% Debt-to-equity ratio 35% Gross profit ratio 40% Net profit ratio 18% Return on equity 22% Return on total assets 10% Total asset turnover ratio 1.1 Fixed asset turnover ratio 2 Current asset turnover ratio 3 10 Interest coverage ratio (times interest earned) Working capital turnover ratio 8 Return on fixed assets 24% EXHIBIT 2: BALANCE SHEET (IN THOUSANDS) 2012-13 201314 2014-15 Assets 1,900 2,500 4,700 Fixed assets (net of depreciation) Current assets Cash and cash equivalents Accounts receivable Inventories 40 300 320 100 1,500 1,500 106 2,100 2,250 2,560 5,600 9,156 Total Equity & Liabilities Equity share capital (shares of 10 each) Reserve & surplus Long-term borrowings Current liabilities 1,200 364 736 260 1,600 1,036 1,236 1,728 2,000 1,876 2,500 2,780 Total 2,560 5,600 9,156 urce: Company's audited financial statement. EXHIBIT 1: INCOME STATEMENT, APRIL 1 TO MARCH 31 (IN THOUSANDS) 2012-13 201314 2014-15 200 1,800 2,000 1,240 760 480 4,320 4,800 2,832 1,968 800 7,200 8,000 4,800 3,200 Sales Cash Credit Total sales Cost of goods sold Gross profit Operating expenses: General, administration, and selling expenses Depreciation Interest expenses (on borrowings) Profit before tax (PBT) Tax @ 30% Profit after tax (PAT) 80 100 60 520 156 364 450 400 158 960 288 672 1,000 660 340 1,200 360 840 2015-2014 2014-2013 2013-2012 Ratio Sector Average Total assets turnover ratio 1.1 0.87 0.85 0.78 Fixed asset turnover ratio 1.90 1.92 1.05 3 Current asset turnover ratio 1.79 1.54 3.03 10 times Interest coverage ratio (times interest earned) 4.52 7.07 9.67 8 times Working capital turnover ratio 4.78 3.4 5 Return on fixed assets 24% 17.87% 26.88% 19.15% O Ratio Sector Average Anandam Manufacturing Co. Years 2015-2014 2014-2013 2013-2012 24% Long-term debt to total debt 47% 41% 73% Debt-to-equity ratio 35% 136.22% 112.44% 63% Gross profit ratio 40% 40% 24.6% 38% Net profit ratio 18% 10.50% 14% 18.20% Return on equity 22% 21.67% 25.49% 23.27% Return on total assets 10% 12% 14.22% 9.17% Ratio Sector Average 2015-2014 2014-2013 2013-2012 Current ratio 2.30:1 1.60:1 1.79:1 2.53 Acid test ratio (quick ratio) 1.20:1 0.79:1 0.92:1 1.30:1 Receivable turnover ratio 7 times 3.4 times 2.88 times 6 times Receivable days 52 days 107.35 126.73 61 Inventory turnover ratio 4.85 times 3.88 2.13 1.88 Inventory days 75 days 171.36 194.14 94