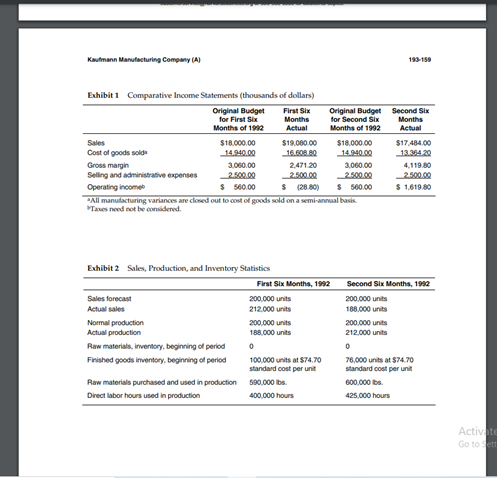
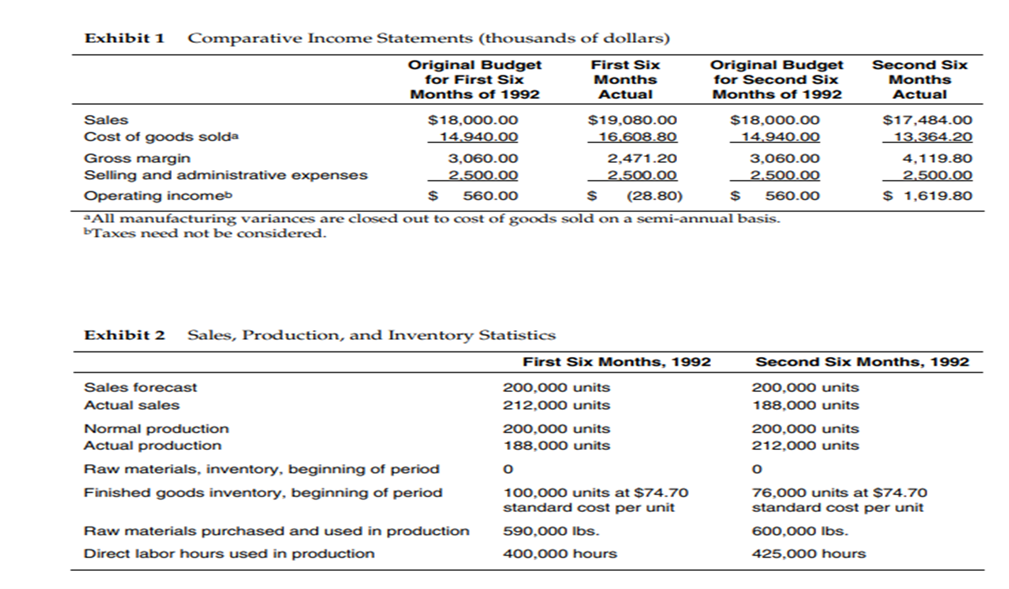
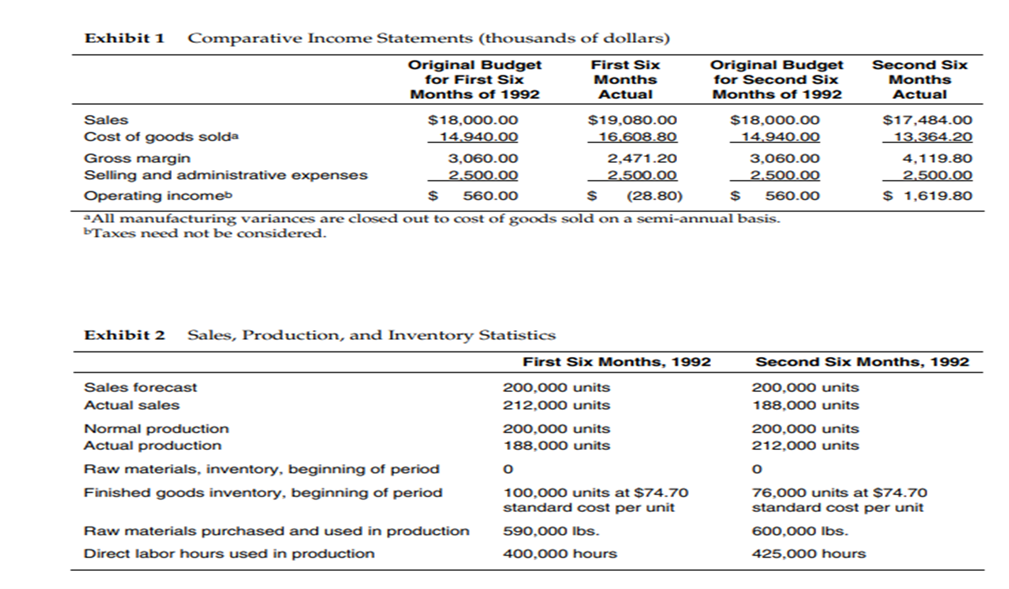
- Compare and evaluate the profit and manufacturing performance of the Kaufmann Manufacturing Company for the first and second six months of 1992.


Kaufmann Manufacturing Company (A) 193-159 Exhibit i Comparative Income Statements (thousands of dollars) Original Budget First Six Original Budget Second Six for First Six Months for Second Six Months Months of 1992 Actual Months of 1992 Actual Sales $18.000.00 $19.080.00 $18,000.00 $17.484.00 Cost of goods solide 14.940.00 16.608.80 14.940.00 13.36420 Gross margin 3.000.00 2,471 20 3,000.00 4.119.80 Selling and administrative expenses 2.500.00 2.500.00 2.500.00 2.500.00 Operating income $ 560.00 $ (28.80) $ 500.00 $ 1.619.80 All manufacturing variances are closed out to cost of goods sold on a semi-annual basis. Tanes need not be considered Exhibit2 Sales, Production, and Inventory Statistics First Six Months, 1992 Sales forecast 200.000 units Actual sales 212.000 units Normal production 200.000 units Actual production 188.000 units Raw materials, inventory, beginning of period 0 Finished goods inventory beginning of period 100.000 units at $74.70 standard cost per unit Raw materials purchased and used in production 590,000 lbs. Direct labor hours used in production 400.000 hours Second Six Months, 1912 200.000 units 188.000 units 200.000 units 212,000 units 0 76.000 units at $74.70 standard cost per unit 600,000 lbs. 425,000 hours Activate Go tott Second Six Months Actual Exhibit 1 Comparative Income Statements (thousands of dollars) Original Budget First Six Original Budget for First Six Months for Second Six Months of 1992 Actual Months of 1992 Sales $18,000.00 $19,080.00 $18,000.00 Cost of goods solda 14.940.00 16.608.80 14.940.00 Gross margin 3.060.00 2.471.20 3.060.00 Selling and administrative expenses 2.500.00 2.500.00 2.500.00 Operating incomeb 560.00 $ (28.80) $ 560.00 a All manufacturing variances are closed out to cost of goods sold on a semi-annual basis. Taxes need not be considered. $17.484.00 13.364.20 4,119.80 2.500.00 $ 1.619.80 Exhibit 2 Sales, Production, and Inventory Statistics First Six Months, 1992 Sales forecast Actual sales Normal production Actual production Raw materials, inventory, beginning of period Finished goods inventory, beginning of period 200.000 units 212,000 units 200,000 units 188.000 units Second Six Months, 1992 200.000 units 188,000 units 200,000 units 212,000 units O 0 Raw materials purchased and used in production Direct labor hours used in production 100,000 units at $74.70 standard cost per unit 590,000 lbs. 400,000 hours 76,000 units at $74.70 standard cost per unit 600.000 lbs. 425,000 hours Second Six Months Actual Exhibit 1 Comparative Income Statements (thousands of dollars) Original Budget First Six Original Budget for First Six Months for Second Six Months of 1992 Actual Months of 1992 Sales $18,000.00 $19,080.00 $18,000.00 Cost of goods solda 14.940.00 16.608.80 14.940.00 Gross margin 3.060.00 2.471.20 3.060.00 Selling and administrative expenses 2.500.00 2.500.00 2.500.00 Operating incomeb 560.00 $ (28.80) $ 560.00 a All manufacturing variances are closed out to cost of goods sold on a semi-annual basis. Taxes need not be considered. $17.484.00 13.364.20 4,119.80 2.500.00 $ 1.619.80 Exhibit 2 Sales, Production, and Inventory Statistics First Six Months, 1992 Sales forecast Actual sales Normal production Actual production Raw materials, inventory, beginning of period Finished goods inventory, beginning of period 200.000 units 212,000 units 200,000 units 188.000 units Second Six Months, 1992 200.000 units 188,000 units 200,000 units 212,000 units O 0 Raw materials purchased and used in production Direct labor hours used in production 100,000 units at $74.70 standard cost per unit 590,000 lbs. 400,000 hours 76,000 units at $74.70 standard cost per unit 600.000 lbs. 425,000 hours Kaufmann Manufacturing Company (A) 193-159 Exhibit i Comparative Income Statements (thousands of dollars) Original Budget First Six Original Budget Second Six for First Six Months for Second Six Months Months of 1992 Actual Months of 1992 Actual Sales $18.000.00 $19.080.00 $18,000.00 $17.484.00 Cost of goods solide 14.940.00 16.608.80 14.940.00 13.36420 Gross margin 3.000.00 2,471 20 3,000.00 4.119.80 Selling and administrative expenses 2.500.00 2.500.00 2.500.00 2.500.00 Operating income $ 560.00 $ (28.80) $ 500.00 $ 1.619.80 All manufacturing variances are closed out to cost of goods sold on a semi-annual basis. Tanes need not be considered Exhibit2 Sales, Production, and Inventory Statistics First Six Months, 1992 Sales forecast 200.000 units Actual sales 212.000 units Normal production 200.000 units Actual production 188.000 units Raw materials, inventory, beginning of period 0 Finished goods inventory beginning of period 100.000 units at $74.70 standard cost per unit Raw materials purchased and used in production 590,000 lbs. Direct labor hours used in production 400.000 hours Second Six Months, 1912 200.000 units 188.000 units 200.000 units 212,000 units 0 76.000 units at $74.70 standard cost per unit 600,000 lbs. 425,000 hours Activate Go tott Second Six Months Actual Exhibit 1 Comparative Income Statements (thousands of dollars) Original Budget First Six Original Budget for First Six Months for Second Six Months of 1992 Actual Months of 1992 Sales $18,000.00 $19,080.00 $18,000.00 Cost of goods solda 14.940.00 16.608.80 14.940.00 Gross margin 3.060.00 2.471.20 3.060.00 Selling and administrative expenses 2.500.00 2.500.00 2.500.00 Operating incomeb 560.00 $ (28.80) $ 560.00 a All manufacturing variances are closed out to cost of goods sold on a semi-annual basis. Taxes need not be considered. $17.484.00 13.364.20 4,119.80 2.500.00 $ 1.619.80 Exhibit 2 Sales, Production, and Inventory Statistics First Six Months, 1992 Sales forecast Actual sales Normal production Actual production Raw materials, inventory, beginning of period Finished goods inventory, beginning of period 200.000 units 212,000 units 200,000 units 188.000 units Second Six Months, 1992 200.000 units 188,000 units 200,000 units 212,000 units O 0 Raw materials purchased and used in production Direct labor hours used in production 100,000 units at $74.70 standard cost per unit 590,000 lbs. 400,000 hours 76,000 units at $74.70 standard cost per unit 600.000 lbs. 425,000 hours Second Six Months Actual Exhibit 1 Comparative Income Statements (thousands of dollars) Original Budget First Six Original Budget for First Six Months for Second Six Months of 1992 Actual Months of 1992 Sales $18,000.00 $19,080.00 $18,000.00 Cost of goods solda 14.940.00 16.608.80 14.940.00 Gross margin 3.060.00 2.471.20 3.060.00 Selling and administrative expenses 2.500.00 2.500.00 2.500.00 Operating incomeb 560.00 $ (28.80) $ 560.00 a All manufacturing variances are closed out to cost of goods sold on a semi-annual basis. Taxes need not be considered. $17.484.00 13.364.20 4,119.80 2.500.00 $ 1.619.80 Exhibit 2 Sales, Production, and Inventory Statistics First Six Months, 1992 Sales forecast Actual sales Normal production Actual production Raw materials, inventory, beginning of period Finished goods inventory, beginning of period 200.000 units 212,000 units 200,000 units 188.000 units Second Six Months, 1992 200.000 units 188,000 units 200,000 units 212,000 units O 0 Raw materials purchased and used in production Direct labor hours used in production 100,000 units at $74.70 standard cost per unit 590,000 lbs. 400,000 hours 76,000 units at $74.70 standard cost per unit 600.000 lbs. 425,000 hours


