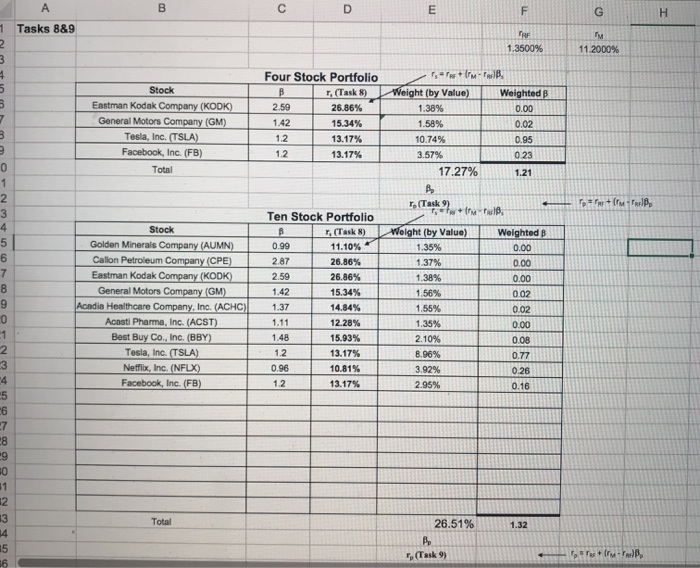
Compare expected Rp's computed for the Expected Portfolio Return for Upcoming 60 months and the Rp's computed in task 9. Explain why these values differ.
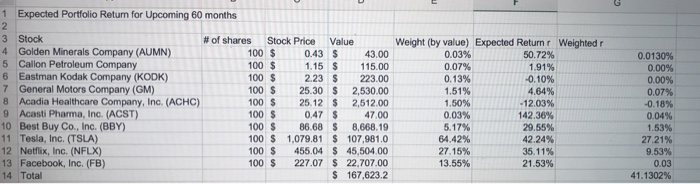
1 Expected Portfolio Retum for Upcoming 60 months 2 3 Stock # of shares Stock Price Value 4 Golden Minerals Company (AUMN) 100 $ 0.43 $ 43.00 5 Callon Petroleum Company 100 $ 1.15$ 115.00 6 Eastman Kodak Company (KODK) 100 $ 2.23 $ 223.00 7 General Motors Company (GM) 100 $ 25.30 $ 2,530.00 8 Acadia Healthcare Company, Inc. (ACHC) 100 $ 25.12 $ 2,512.00 9 Acasti Pharma, Inc. (ACST) 100 $ 0.47 $ 47.00 10 Best Buy Co., Inc. (BBY) 100 $ 86.68 $ 8,668.19 11 Tesla, Inc. (TSLA) 100 $ 1,079.81 $ 107,981.0 12 Netflix, Inc. (NFLX) 100 $ 455.04 $ 45,504.00 13 Facebook, Inc. (FB) 100 $ 227.07 $ 22.707.00 14 Total $ 167,623.2 Weight (by value) Expected Return Weighted 0.03% 50.72% 0.07% 1.91% 0.13% -0.10% 1.51% 4.64% 1.50% -12.03% 0.03% 142.36% 5.17% 29.55% 64.42% 42.24% 27.15% 35.11% 13.55% 21.53% 0.0130% 0.00% 0.00% 0.07% -0.18% 0.04% 1.53% 27.21% 9.53% 0.03 41.1302% B D E F G H Tasks 889 TRF 1.3500% IM 11.2000% 2. 3 4 5 UD Stock Eastman Kodak Company (KODK) General Motors Company (GM) Tesla, Inc. (TSLA) Facebook, Inc. (FB) Total Four Stock Portfolio B r. (Task 8) 2.59 26.86% 1.42 15.34% 12 13.17% 12 13.17% 1,7 m-PB Weight (by Value) Weighted 1.38% 0.00 1.58% 0.02 10.74% 0.95 3.57% 023 17.27% 1.21 3 2 0 1 2 3 4 5 Tort JB Terra 0.99 7 8 9 0 Stock Golden Minerals Company (AUMN) Callon Petroleum Company (CPE) Eastman Kodak Company (KODK) General Motors Company (GM) Acadia Healthcare Company, Inc. (ACHC) Acesti Pharma, Inc. (ACST) Best Buy Co., Inc. (BBY) Tesla, Inc. (TSLA) Netflix, Inc. (NFLX) Facebook, Inc. (FB) Ten Stock Portfolio B r. (Task 8) 11.10% 2.87 26.86% 2.59 26.86% 1.42 15.34% 1.37 14.84% 1.11 12.28% 1.48 15.93% 1.2 13.17% 0.96 10.81% 1.2 13.17% Wolght (by Value) 1.35% 1.37% 1.38% 1.56% 1.55% 1.35% 2.10% 8.96% 3.92% 2.95% Wolghted B 0.00 0.00 0.00 0.02 0.02 0.00 0.08 0.77 0.26 0.16 1 2 3 4 5 6 28 9 0 11 12 3 Total 26.51% 1.32 4 15 16 T. (Task 9) *Tas + (rm-PB 1 Expected Portfolio Retum for Upcoming 60 months 2 3 Stock # of shares Stock Price Value 4 Golden Minerals Company (AUMN) 100 $ 0.43 $ 43.00 5 Callon Petroleum Company 100 $ 1.15$ 115.00 6 Eastman Kodak Company (KODK) 100 $ 2.23 $ 223.00 7 General Motors Company (GM) 100 $ 25.30 $ 2,530.00 8 Acadia Healthcare Company, Inc. (ACHC) 100 $ 25.12 $ 2,512.00 9 Acasti Pharma, Inc. (ACST) 100 $ 0.47 $ 47.00 10 Best Buy Co., Inc. (BBY) 100 $ 86.68 $ 8,668.19 11 Tesla, Inc. (TSLA) 100 $ 1,079.81 $ 107,981.0 12 Netflix, Inc. (NFLX) 100 $ 455.04 $ 45,504.00 13 Facebook, Inc. (FB) 100 $ 227.07 $ 22.707.00 14 Total $ 167,623.2 Weight (by value) Expected Return Weighted 0.03% 50.72% 0.07% 1.91% 0.13% -0.10% 1.51% 4.64% 1.50% -12.03% 0.03% 142.36% 5.17% 29.55% 64.42% 42.24% 27.15% 35.11% 13.55% 21.53% 0.0130% 0.00% 0.00% 0.07% -0.18% 0.04% 1.53% 27.21% 9.53% 0.03 41.1302% B D E F G H Tasks 889 TRF 1.3500% IM 11.2000% 2. 3 4 5 UD Stock Eastman Kodak Company (KODK) General Motors Company (GM) Tesla, Inc. (TSLA) Facebook, Inc. (FB) Total Four Stock Portfolio B r. (Task 8) 2.59 26.86% 1.42 15.34% 12 13.17% 12 13.17% 1,7 m-PB Weight (by Value) Weighted 1.38% 0.00 1.58% 0.02 10.74% 0.95 3.57% 023 17.27% 1.21 3 2 0 1 2 3 4 5 Tort JB Terra 0.99 7 8 9 0 Stock Golden Minerals Company (AUMN) Callon Petroleum Company (CPE) Eastman Kodak Company (KODK) General Motors Company (GM) Acadia Healthcare Company, Inc. (ACHC) Acesti Pharma, Inc. (ACST) Best Buy Co., Inc. (BBY) Tesla, Inc. (TSLA) Netflix, Inc. (NFLX) Facebook, Inc. (FB) Ten Stock Portfolio B r. (Task 8) 11.10% 2.87 26.86% 2.59 26.86% 1.42 15.34% 1.37 14.84% 1.11 12.28% 1.48 15.93% 1.2 13.17% 0.96 10.81% 1.2 13.17% Wolght (by Value) 1.35% 1.37% 1.38% 1.56% 1.55% 1.35% 2.10% 8.96% 3.92% 2.95% Wolghted B 0.00 0.00 0.00 0.02 0.02 0.00 0.08 0.77 0.26 0.16 1 2 3 4 5 6 28 9 0 11 12 3 Total 26.51% 1.32 4 15 16 T. (Task 9) *Tas + (rm-PB