Compare inventory turns, ROA, and ROE for Apple and their competitor Samsung, at the time the case was written. Briefly provide the computation for each one (state which year(s) you used). Look at the big picture-- how do they compare?
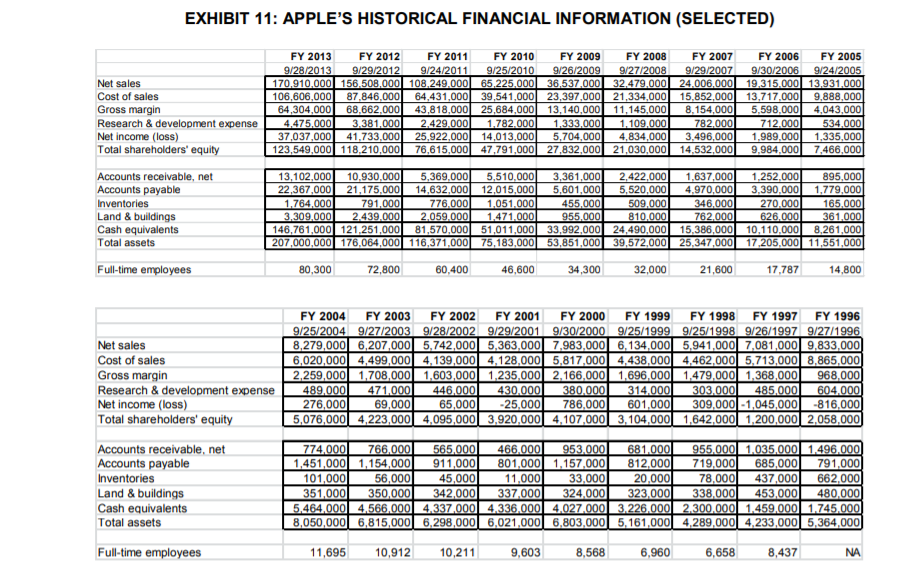
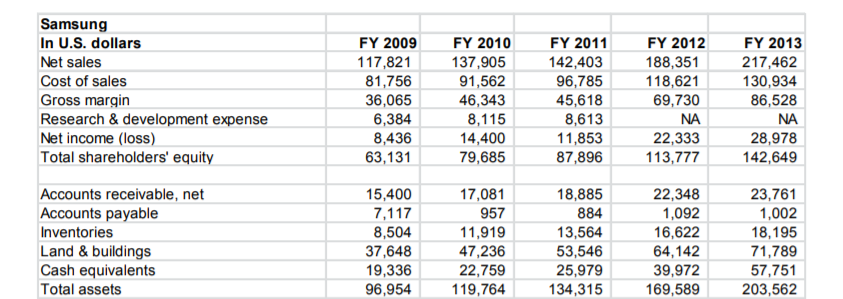
EXHIBIT 11: APPLE'S HISTORICAL FINANCIAL INFORMATION (SELECTED) FY 2013 FY 2012 FY 2011 9/28/2013 9/29/2012 9/24/2011 Net sales 170.910.000 156.508,000 108.249.000 Cost of sales 106,606,000 87,846,000 64,431,000 Gross margin 64,304,000 68,662,000 43,818,000 Research & development expense L 4.475.000 3.381.000 2.429.000 Net income (loss) 37,037,000| 41,733,000 25,922,000 Total shareholders' equity 123,549,000 118,210,000 76,615,000 FY 2010 FY 2009 FY 2008 9/25/20109/26/2009 9/27/2008 65.225.000 36.537.000 32.479.000 39,541,000 23,397,000 21,334,000 25,684,000 13,140,000 11,145,000 1.782.000 1.333.000 1.109.000 14,013,000 5,704,000 4,834,000 47,791,000 27,832,000 21,030,000 FY 2007 9/29/2007 24.006.000 15,852,000 8.154,000 782,000 3,496,000 14,532,000 FY 2006 FY 2005 9/30/2006 9/24/2005 19.315.000 13.931.000 13,717,000 9,888,000 5,598,000 4,043,000 712.000 534.000 1,989.000 1,335,000 9.984,000 7,466,000 Accounts receivable, net Accounts payable Inventories Land & buildings Cash equivalents Total assets 13,102,000 10,930.000 5,369,000 22,367,000 21,175,000 14.632,000 1.764,000 791,000 776.000 3.309.000 2.439.000 2.059.000 146,761,000 121,251,000 81,570,000 207,000,000 176,064,000 116,371,000 5,510,000 12,015,000 1.051.000 1.471.000 51,011,000 75,183,000 3,361,000 5,601,000 455.000 955.000 33,992,000 53,851.000 2,422,000 5,520,000 509.000 810.000 24,490,000 39,572,000 1,637,000 4,970,000 346.000 762.000 15,386,000 25,347,000 1,252.000 3,390,000 270.000 626.000 10,110,000 17,205,000 895,000 1,779,000 165.000 361,000 8,261,000 11,551,000 Full-time employees 80,300 72,800 60,400 46,600 34,300 32,000 21,600 17,787 14,800 Net sales Cost of sales Gross margin Research & development expense Net income (loss) Total shareholders' equity FY 2004 FY 2003 FY 2002 9/25/2004 9/27/2003 9/28/2002 8,279,000 6,207,000 5.742,000 6,020,000 4,499,000 4,139,000 2.259,000 1,708,000 1,603,000 489,000 471,000 446,000 276,000 69,000 65,000 5,076,000 4,223,000 4,095,000 FY 2001 FY 2000 FY 1999 FY 1998 FY 1997 FY 1996 9/29/2001 9/30/2000 9/25/1999 9/25/1998 9/26/1997 9/27/1996 5,363,000 7,983,000 6,134,000 5,941,000 7,081,000 9,833,000 4,128,000 5,817.000 4,438,000 4,462.000l 5.713,000 8,865,000 1,235,000 2.166,000 1,696,000 1,479,000 1,368,000 968,000 430.000 380.000 314,000 303.000 485,0001 604,000 -25,000 786,000 601,000 309,000 -1,045,000 -816,000 3,920,000 4,107,000 3,104,000 1,642,000 1,200,000 2,058,000 Accounts receivable, net Accounts payable Inventories Land & buildings Cash equivalents Total assets 774,000) 766,000 565,000 1,451,000 1,154,000 911,000 101,000 56,000 45,000 351,000| 350,000 342.000 5,464,000 4,566.000 4.337.000 8,050,000 6,815,000 6.298,000 466.000 953.000 681.000 955.000 1.035.000] 1.496.000 801,000 1,157.000 812,000 719,000 685,000 791,000 11,000 33,000| 20,000 78,000| 437,000 662,000 337.000 324.000 323,000 338,000 453.000 480,000 4.336.000 4.027.000 3.226.000 2.300.000 1.459.000 1.745.000 6,021,000/ 6.803,000 5,161,000 4,289,000 4.233,000 5,364,000 Full-time employees 11,695 10,912 10,211 9,603 8,568 6,960 6,658 8,437 NA Samsung In U.S. dollars Net sales Cost of sales Gross margin Research & development expense Net income (loss) Total shareholders' equity FY 2009 117,821 81,756 36,065 6,384 8,436 63,131 FY 2010 137,905 91,562 46,343 8,115 14,400 79,685 FY 2011 142,403 96,785 45,618 8,613 11,853 87,896 FY 2012 188,351 118,621 69,730 NA 22,333 113,777 FY 2013 217,462 130,934 86,528 NA 28,978 142,649 Accounts receivable, net Accounts payable Inventories Land & buildings Cash equivalents Total assets 15,400 7,117 8,504 37,648 19,336 96,954 17,081 957 11,919 47,236 22,759 119,764 18,885 884 13,564 53,546 25,979 134,315 22,348 1,092 16,622 64,142 39,972 169,589 23,761 1,002 18,195 71,789 57,751 203,562 EXHIBIT 11: APPLE'S HISTORICAL FINANCIAL INFORMATION (SELECTED) FY 2013 FY 2012 FY 2011 9/28/2013 9/29/2012 9/24/2011 Net sales 170.910.000 156.508,000 108.249.000 Cost of sales 106,606,000 87,846,000 64,431,000 Gross margin 64,304,000 68,662,000 43,818,000 Research & development expense L 4.475.000 3.381.000 2.429.000 Net income (loss) 37,037,000| 41,733,000 25,922,000 Total shareholders' equity 123,549,000 118,210,000 76,615,000 FY 2010 FY 2009 FY 2008 9/25/20109/26/2009 9/27/2008 65.225.000 36.537.000 32.479.000 39,541,000 23,397,000 21,334,000 25,684,000 13,140,000 11,145,000 1.782.000 1.333.000 1.109.000 14,013,000 5,704,000 4,834,000 47,791,000 27,832,000 21,030,000 FY 2007 9/29/2007 24.006.000 15,852,000 8.154,000 782,000 3,496,000 14,532,000 FY 2006 FY 2005 9/30/2006 9/24/2005 19.315.000 13.931.000 13,717,000 9,888,000 5,598,000 4,043,000 712.000 534.000 1,989.000 1,335,000 9.984,000 7,466,000 Accounts receivable, net Accounts payable Inventories Land & buildings Cash equivalents Total assets 13,102,000 10,930.000 5,369,000 22,367,000 21,175,000 14.632,000 1.764,000 791,000 776.000 3.309.000 2.439.000 2.059.000 146,761,000 121,251,000 81,570,000 207,000,000 176,064,000 116,371,000 5,510,000 12,015,000 1.051.000 1.471.000 51,011,000 75,183,000 3,361,000 5,601,000 455.000 955.000 33,992,000 53,851.000 2,422,000 5,520,000 509.000 810.000 24,490,000 39,572,000 1,637,000 4,970,000 346.000 762.000 15,386,000 25,347,000 1,252.000 3,390,000 270.000 626.000 10,110,000 17,205,000 895,000 1,779,000 165.000 361,000 8,261,000 11,551,000 Full-time employees 80,300 72,800 60,400 46,600 34,300 32,000 21,600 17,787 14,800 Net sales Cost of sales Gross margin Research & development expense Net income (loss) Total shareholders' equity FY 2004 FY 2003 FY 2002 9/25/2004 9/27/2003 9/28/2002 8,279,000 6,207,000 5.742,000 6,020,000 4,499,000 4,139,000 2.259,000 1,708,000 1,603,000 489,000 471,000 446,000 276,000 69,000 65,000 5,076,000 4,223,000 4,095,000 FY 2001 FY 2000 FY 1999 FY 1998 FY 1997 FY 1996 9/29/2001 9/30/2000 9/25/1999 9/25/1998 9/26/1997 9/27/1996 5,363,000 7,983,000 6,134,000 5,941,000 7,081,000 9,833,000 4,128,000 5,817.000 4,438,000 4,462.000l 5.713,000 8,865,000 1,235,000 2.166,000 1,696,000 1,479,000 1,368,000 968,000 430.000 380.000 314,000 303.000 485,0001 604,000 -25,000 786,000 601,000 309,000 -1,045,000 -816,000 3,920,000 4,107,000 3,104,000 1,642,000 1,200,000 2,058,000 Accounts receivable, net Accounts payable Inventories Land & buildings Cash equivalents Total assets 774,000) 766,000 565,000 1,451,000 1,154,000 911,000 101,000 56,000 45,000 351,000| 350,000 342.000 5,464,000 4,566.000 4.337.000 8,050,000 6,815,000 6.298,000 466.000 953.000 681.000 955.000 1.035.000] 1.496.000 801,000 1,157.000 812,000 719,000 685,000 791,000 11,000 33,000| 20,000 78,000| 437,000 662,000 337.000 324.000 323,000 338,000 453.000 480,000 4.336.000 4.027.000 3.226.000 2.300.000 1.459.000 1.745.000 6,021,000/ 6.803,000 5,161,000 4,289,000 4.233,000 5,364,000 Full-time employees 11,695 10,912 10,211 9,603 8,568 6,960 6,658 8,437 NA Samsung In U.S. dollars Net sales Cost of sales Gross margin Research & development expense Net income (loss) Total shareholders' equity FY 2009 117,821 81,756 36,065 6,384 8,436 63,131 FY 2010 137,905 91,562 46,343 8,115 14,400 79,685 FY 2011 142,403 96,785 45,618 8,613 11,853 87,896 FY 2012 188,351 118,621 69,730 NA 22,333 113,777 FY 2013 217,462 130,934 86,528 NA 28,978 142,649 Accounts receivable, net Accounts payable Inventories Land & buildings Cash equivalents Total assets 15,400 7,117 8,504 37,648 19,336 96,954 17,081 957 11,919 47,236 22,759 119,764 18,885 884 13,564 53,546 25,979 134,315 22,348 1,092 16,622 64,142 39,972 169,589 23,761 1,002 18,195 71,789 57,751 203,562