Question
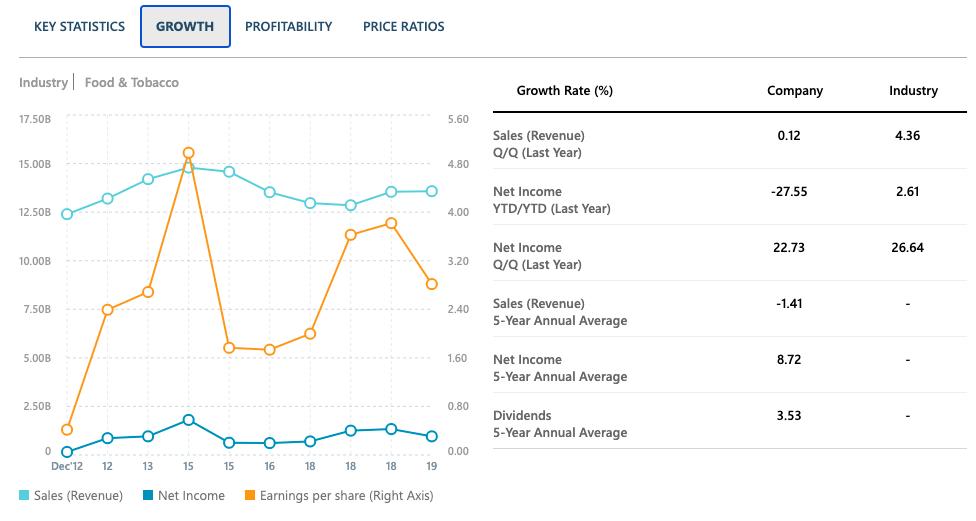
Compare Kellog's Performance to the industry A. Look at Growth i. Sales growth for the last quarter vs. the same quarter a year ago a.
Compare Kellog's Performance to the industry
A. Look at Growth
i. Sales growth for the last quarter vs. the same quarter a year ago
a. What is Kellogg’s?
b. What is it for the industry?
c. How does Kellogg compare?
ii. Net Income Growth for the last year vs. year ago
a. What is Kellog's?
b. What is it for the industry?
c. How does Kellogg compare?
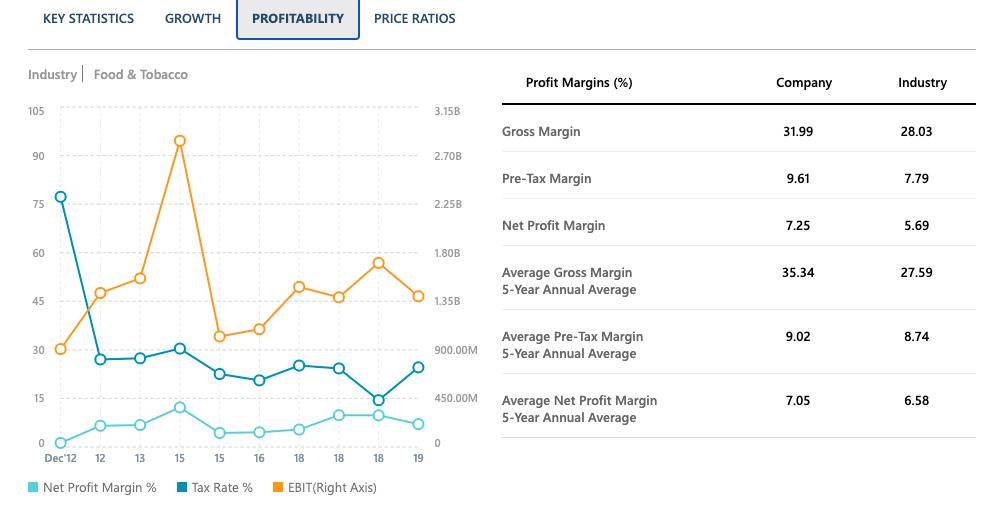
B. Look at Profitability
i. Net Profit Margin
a. What is Kellog's?
b. What is it for the industry?
c. How does Kellogg compare?
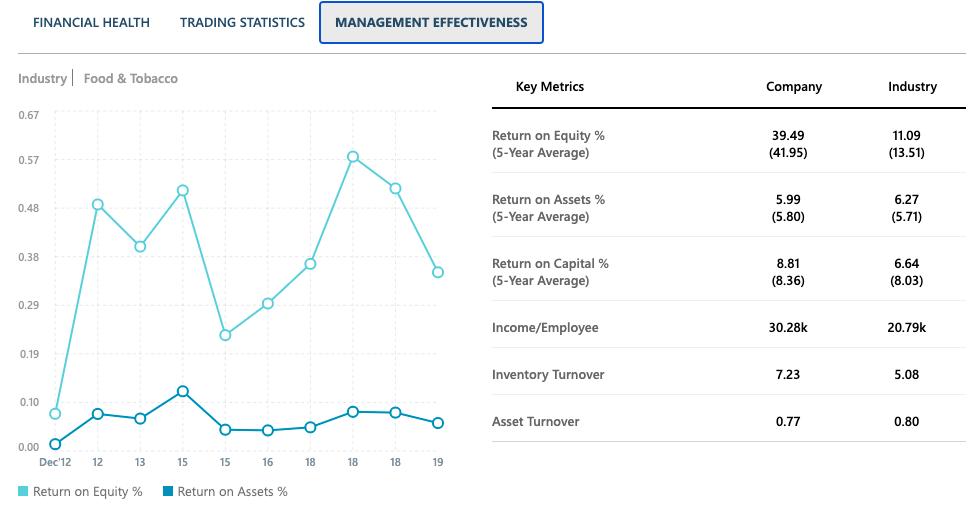
C. Look at Management Effectiveness in the middle of the page:
i. Return on Equity
a. What is Kellog's?
b. What is it for the industry?
c. How does Kellogg compare?


KEY STATISTICS GROWTH PROFITABILITY PRICE RATIOS Industry Food & Tobacco Growth Rate (%) Company Industry 17.50B 5.60 Sales (Revenue) Q/Q (Last Year) 0.12 4.36 15.00B 4.80 Net Income -27.55 2.61 12.50B O YTD/YTD (Last Year) 4.00 Net Income 22.73 26.64 10.00B 3.20 Q/Q (Last Year) Sales (Revenue) 5-Year Annual Average -1.41 7.50B 2.40 5.00B 1.60 Net Income 8.72 5-Year Annual Average 2.50B 0.80 Dividends 3.53 5-Year Annual Average 0.00 Dec'12 12 13 15 15 16 18 18 18 19 I Sales (Revenue) I Net Income I Earnings per share (Right Axis)
Step by Step Solution
3.50 Rating (153 Votes )
There are 3 Steps involved in it
Step: 1
Answer Ai Sales growth for the last quarter vs the same quarter a year ago a Kellogs sales have grow...
Get Instant Access to Expert-Tailored Solutions
See step-by-step solutions with expert insights and AI powered tools for academic success
Step: 2

Step: 3

Ace Your Homework with AI
Get the answers you need in no time with our AI-driven, step-by-step assistance
Get Started


