

Question
Compare the payer mix of the hospitals above and answer these questions: What do the data tell you about the market, market share, payer mix,
Compare the payer mix of the hospitals above and answer these questions:
-
What do the data tell you about the market, market share, payer mix, service offerings and long term financial sustainability of each (make general observations based on comparing and contrasting the differences with each)? Focus on the limited information available.
-
What specific services or market share disparity might account for the differences?
-
What implication does payer mix, market share, and the type of services delivered have on the operational revenues of these organizations?
-
How would you rank order the financial viability of the hospitals researched?
-
How would this data influence strategic planning considerations for these organizations (generally)?Who (what services) might have more resources for budgeting; who would be most restricted? Why?
-
What are the implications on the people served by the organizations (what stands out)? Which organization might offer more or fewer services?
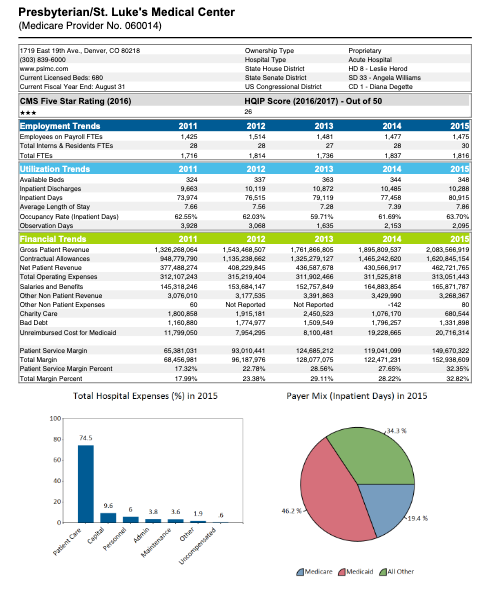
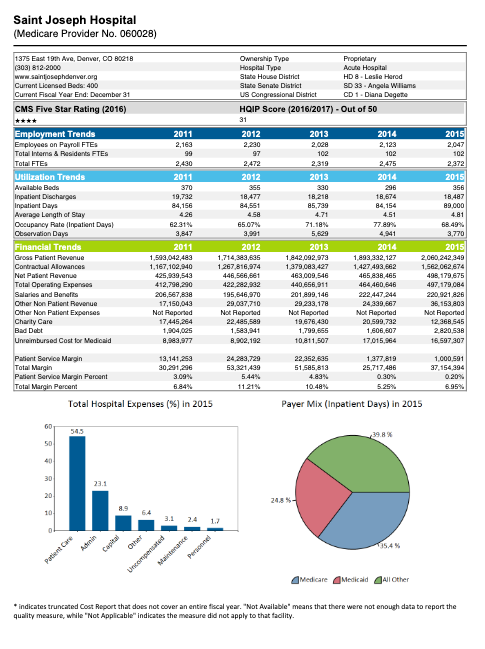
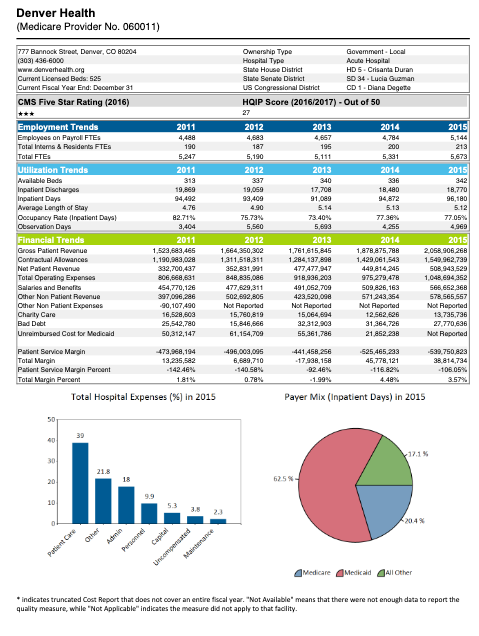
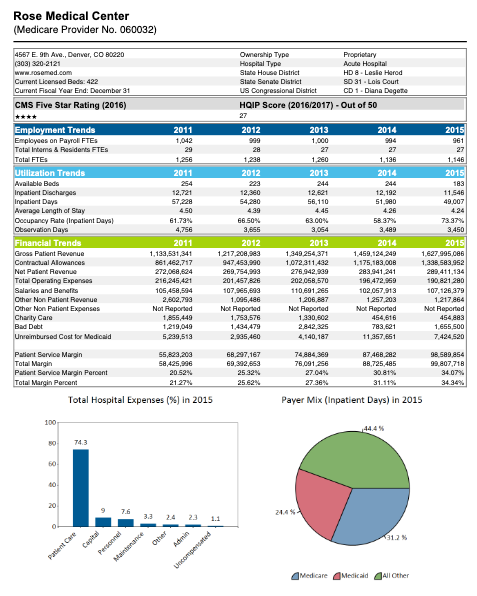
Presbyterian/St. Luke's Medical Center (Medicare Provider No. 060014) 1719 East 191h Ave., Denver, CO 80218 (303) 839-6000 www.paime.com Current Licensed Beds: 680 Current Fiscal Year End: August 31 CMS Five Star Rating (2016) 2011 1,425 28 1.477 1,716 Employment Trends Employees on Payroll FTES Total Items & Residents FTES Total FTES Utilization Trends Available Beda Inpatient Discharges Inpatient Days Average Length of Stay Cocupancy Rate (reatient Days) Observation Days Financial Trends Gross Patient Revenue Contractual Alowances Net Patient Revenue Total Operating Expenses Salaries and Benefits Other Non Patient Revenue Other Non Patient Expenses Charity Care Bad Debt Unreimbursed Cost for Medicaid 2011 324 9,863 73,974 7.66 62.55% 9,928 2011 1,326,268,064 948,779,790 377,488,274 312,107,243 145,318,246 3,076,010 60 1.800,850 1,160,880 11,799,060 Ownership Type Proprietary Hospital Type Acute Hospital State House District HD 8 - Leslie Herod State Senate District SD 33. Angela Wiliams US Congressional District CD 1. Diana Degete HQIP Score (2016/2017) - Out of 50 25 2012 2013 2014 2015 1,514 1.481 1.475 28 27 28 30 1,814 1.738 1.837 1.816 2012 2013 2014 2015 337 363 344 348 10,119 10.872 10,485 10.288 76,515 79,119 77 458 80,915 7.56 7.28 7.99 7.86 62.03% 59.71% 61.69% 63.70% 3,068 1.635 2,153 2,095 2012 2013 2014 2015 1.543,468,507 1,761.866.805 1,895 809,587 2.083,566,919 1,125,238,662 1.325 279,127 1.465 242,620 1.620.845,154 408,229,845 496,587,678 490,566,917 462.721,765 315,219,404 311.902.466 311.525,818 313,051 443 153,684,147 152,757,840 164.883,854 165,871,787 3,177,536 3,391,863 3,429,900 3.268.367 Not Reported Not Reported -142 80 1,915,181 2,450,523 1,076,170 680,544 1.774,977 1.509.549 1.796,257 1,331 898 7,964,295 8,100,481 19.228,665 20.716.314 93,010,441 124,685,212 119,041,099 149.670.322 96, 187,076 128,077,075 122.471.231 152.938.609 22.78% 28.56% 27.65% 32.95% 23.A 29.11% 28.22% 32.82% Patient Service Margin 65,381,031 Total Margin 68,456,981 Patient Service Margin Percent 17.32% Total Margin Percent 17.99% Total Hospital Expenses (%) in 2015 Payer Mix (Inpatient Days) in 2015 100 74.5 20 9.6 1.9 462 1945 Putlet Capital Personnel tenance created Medicare Medicaid All Other Saint Joseph Hospital (Medicare Provider No. 060028) 1375 East 19th Ave, Denver, CO 80218 (303) 812-2000 www.saintjosephdenver.org Current Licensed Beds: 400 Current Fiscal Year End: December 31 CMS Five Star Rating (2016) Employment Trends Employees on Payroll FTES Total Items & Residents FTES Total FTES Utilization Trends Available Beds Inpatient Discharges Inpatient Days Average Length of Stay Cocupancy Rate (Inpatient Days) Observation Days Financial Trends Gross Patient Revenue Contractual Alowances Net Patient Revenue Total Operating Expenses Salaries and Benefits Other Non Patient Revenue Other Non Patient Expenses Charity Care Bad Debt Unreimbursed Cost for Medicaid 18.477 2011 2,163 99 2,430 2011 370 19,732 84,156 426 62.31% 9.17 2011 1.599,042,483 1.167,102,940 425,929,543 412,798,290 206,567,838 17,150,043 Not Reported 17,445,264 1,904.025 8,983,977 Ownership Type Proprietary Hospital Type Acute Hospital State House District HD 8. Lesie Herod State Senate District SD 33 - Angela Wiliams US Congressional District CD 1. Diana Degete HQIP Score (2016/2017) - Out of 50 31 2012 2013 2014 2015 2,230 2,028 2,123 2,047 97 102 102 102 2.472 2.319 2,475 2.372 2012 2013 2014 2015 355 330 296 356 18,218 18,674 18,487 84,551 85,730 84,154 89.000 4.50 4.71 4.51 4.81 65.07 71.18% 77.89% 68.49% 4,941 3.770 2012 2013 2014 2015 1.714,383.006 1.842,092,973 1,893,392,127 2060 242 349 1.267,816,974 1,379,063.427 1,427 493,662 1.562.062,674 446,566,661 463,009,546 465,838,465 498, 179,675 422,282,942 440,656,911 464,460,546 497,179,084 195,546,970 201.899,146 222,447 244 220.921.826 29,087,710 29 233,178 24,399.667 36.153.803 Not Reported Not Reported Not Reported Not Reported 22,485,589 19,676,430 20,599.792 12 368,545 1,589,91 1.799,665 1.606,507 2.820,538 8,902,192 10.811,507 17.015,964 16.597 307 Patient Service Margin 13,141,253 Total Margin 30,201,206 Patient Service Margin Percent 3.09% Total Margin Percent 6.84% Total Hospital Expenses (%) in 2015 24 283,729 53,321,439 5.44% 11 21 22.352,635 1.377,819 51.585,813 25,717,486 4.89% 0.30% 10.48 5.25% Payer Mix (Inpatient Days) in 2015 1.000,591 37,154394 0.20% 6.95% 60 39.8% 50 30 I..... 20 248% 10 1.7 0 des Other Patient Care Ucenated Maintenance Medicare Medicaid All Other * indicates truncated Cost Report that does not cover an entire fiscal year. "Not Available means that there were not enough data to report the quality measure, while "Not Applicable" indicates the measure did not apply to that facility. Denver Health (Medicare Provider No. 060011) 777 Bannock Street, Denver, CO 80204 (303) 436-6000 www.deverhealth.org Current Licensed Beds: 525 Current Fiscal Year End: December 31 CMS Five Star Rating (2016) 2011 4,488 190 5.247 2011 313 19,860 94,492 4.76 82.71% 9,404 Ownership Type Goverment Local Hospital Type Acute Hospital State House District HD 5. Crisanta Duran State Sense District SD 34. Lucia Guaman US Congressional District CD 1 Diana Degete HQIP Score (2016/2017) - Out of 50 27 2012 2013 2014 4,683 4.657 4,784 187 195 200 5,190 5.111 5.331 2012 2013 2014 337 340 336 19,069 17.708 18.480 99,409 91.009 94.872 4.90 5.14 5.13 75.79% 73.40% 77.38% 5,560 5,693 4.255 2012 2013 2014 1.664,350,302 1,761.615,845 1,878,875,786 1.311.518,311 1284,197.80 1.429,061,543 352,831,991 477 477,947 449,814, 245 848,835,086 918.996.209 975,279,478 477,629,311 491,052,700 509,826,163 502,682,805 423,520,098 571 243,354 Not Reported Not Reported Not Reported 15.760,819 15,064,694 12,562,626 15.846,666 22,312,903 31 364.726 61.154,700 55 361,786 21.852,238 Employment Trends Employees on Payroll FTES Total Inters & Residents FTES Total FTES Utilization Trends Available Beds Inpatient Discharges Inpatient Days Average Length of Stay Cocupancy Rate Inpatient Days) Observation Days Financial Trends Gross Patient Revenue Contractual Alowances Net Patient Revenue Total Operating Expenses Salaries and Bones Other Non Patient Revenue Other Non Patient Expenses Charity Care Bad Debt Unreimbursed Cost for Medicaid Patient Service Margin Total Margin Patient Service Margin Percent Total Margin Porcent 2015 5,144 213 5,673 2015 342 18,770 96,180 5.12 77.05 4.969 2011 1,529,683,465 1,190,963,028 332,700,437 806,668,631 454,770,126 397,096,286 90,107,490 16,528,500 25,542,780 50,312,147 2015 2.058.906.268 1,549.962,799 508.943,529 1,048.604,352 566.652.368 578.565 557 Not Reported 13.795,736 27,770.636 Not Reported -473,968,194 13,235,582 -142.46% 1.81% -496,009,035 6,689,710 -140.58% 0.78% -441,458,25 -17.998,158 -92.46% -1.99% -525,465,239 45,778,121 -116.82% 4.48% -539.750.823 38.814,794 -105.05% 3.57% Total Hospital Expenses (%) in 2015 Payer Mix (Inpatient Days) in 2015 50 12.15 30 21.8 20 18 625% 10 53 0 204% Personnel Admin Capital Patient Care Uncompensated Maintenance Medicare Medical All Other * indicates truncated Cost Report that does not cover an entire fiscal year. "Not Available means that there were not enough data to report the quality measure, while "Not Applicable" indicates the measure did not apply to that facility. Rose Medical Center (Medicare Provider No. 060032) 2011 1,042 29 2011 4557 E 9th Ave., Denver, CO 80220 (303320-2121 www.rosemed.com Current Licensed Beds: 422 Current Fiscal Year End: December 31 CMS Five Star Rating (2016) **** Employment Trends Employees on Payroll FTES Total Items & Residents FTES Total FTES Utilization Trends Available Beda Inpatient Discharges Inpatient Days Average Length of Stay Cocupancy Rate Irpatient Days) Observation Days Financial Trends Gross Patient Revenue Contractual Alowances Net Patient Revenue Total Operating Expenses Salaries and Bones Other Non Patient Revenue Other Non Patient Expenses Charity Care Bad Debt Unreimbursed Cost for Medicaid 12,721 57,228 4.50 61.73% 4,756 2011 1,133,531,341 861,462,717 272,068,624 216,245,421 105,458,594 2,602,798 Not Reported 1,855,449 1,219,049 5,239,513 Ownership Type Proprietary Hospital Type Acute Hospital State House District HD 8 - Leslie Herod State Senate District SD 31. Lois Court US Congressional District CD 1 - Diana Degete HQIP Score (2016/2017) - Out of 50 27 2012 2013 2014 2015 999 1.000 961 28 27 27 27 1,238 1.260 1,136 1146 2012 2013 2014 2015 244 244 183 12,310 12,621 12,192 11.546 54,280 56,110 51.900 49.007 4.39 4.45 4.26 4.24 66.50% 63.00% 58.37% 73.37% 2,665 3,064 3,499 3.450 2012 2013 2014 2015 1217,208,sea 1 349 254,371 1,459,124,249 1.627 995086 947,453,990 1,072,311,432 1.175.183.000 1,338,583,952 269,754,993 278.942,989 283,941 241 289 411,194 201,457,826 202,058,570 196,472,969 190,821 280 107,965,693 110.691.265 102,057,913 107, 126,379 1,005,486 1.206,887 1.257,203 1,217 864 Not Reported Not Reported Not Reported Not Reported 1,753,570 1,330,602 454,516 454,883 1,434,479 2,842,325 783,621 1,655,500 2,935,460 4.140.187 11,357,651 7.424,520 68,297,167 74,884,369 87.468,292 98.589,854 69.392,663 78.091.256 88,725,485 99,807,718 25.32% 27.04% 30.81% 3407 25.62% 27.36% 31.11% 34.34% Payer Mix (Inpatient Days) in 2015 Patient Service Margin 55,823,200 Total Margin 58,425,906 Patient Service Margin Percent 20.52% Total Margin Percent 21 27% Total Hospital Expenses (%) in 2015 100 44.4% 74.3 60 20 2.3 2445 1.1 Personnel Capital 31.2% Admin Patiente Maintenance Uncome Medicare Medicaid All Other Presbyterian/St. Luke's Medical Center (Medicare Provider No. 060014) 1719 East 191h Ave., Denver, CO 80218 (303) 839-6000 www.paime.com Current Licensed Beds: 680 Current Fiscal Year End: August 31 CMS Five Star Rating (2016) 2011 1,425 28 1.477 1,716 Employment Trends Employees on Payroll FTES Total Items & Residents FTES Total FTES Utilization Trends Available Beda Inpatient Discharges Inpatient Days Average Length of Stay Cocupancy Rate (reatient Days) Observation Days Financial Trends Gross Patient Revenue Contractual Alowances Net Patient Revenue Total Operating Expenses Salaries and Benefits Other Non Patient Revenue Other Non Patient Expenses Charity Care Bad Debt Unreimbursed Cost for Medicaid 2011 324 9,863 73,974 7.66 62.55% 9,928 2011 1,326,268,064 948,779,790 377,488,274 312,107,243 145,318,246 3,076,010 60 1.800,850 1,160,880 11,799,060 Ownership Type Proprietary Hospital Type Acute Hospital State House District HD 8 - Leslie Herod State Senate District SD 33. Angela Wiliams US Congressional District CD 1. Diana Degete HQIP Score (2016/2017) - Out of 50 25 2012 2013 2014 2015 1,514 1.481 1.475 28 27 28 30 1,814 1.738 1.837 1.816 2012 2013 2014 2015 337 363 344 348 10,119 10.872 10,485 10.288 76,515 79,119 77 458 80,915 7.56 7.28 7.99 7.86 62.03% 59.71% 61.69% 63.70% 3,068 1.635 2,153 2,095 2012 2013 2014 2015 1.543,468,507 1,761.866.805 1,895 809,587 2.083,566,919 1,125,238,662 1.325 279,127 1.465 242,620 1.620.845,154 408,229,845 496,587,678 490,566,917 462.721,765 315,219,404 311.902.466 311.525,818 313,051 443 153,684,147 152,757,840 164.883,854 165,871,787 3,177,536 3,391,863 3,429,900 3.268.367 Not Reported Not Reported -142 80 1,915,181 2,450,523 1,076,170 680,544 1.774,977 1.509.549 1.796,257 1,331 898 7,964,295 8,100,481 19.228,665 20.716.314 93,010,441 124,685,212 119,041,099 149.670.322 96, 187,076 128,077,075 122.471.231 152.938.609 22.78% 28.56% 27.65% 32.95% 23.A 29.11% 28.22% 32.82% Patient Service Margin 65,381,031 Total Margin 68,456,981 Patient Service Margin Percent 17.32% Total Margin Percent 17.99% Total Hospital Expenses (%) in 2015 Payer Mix (Inpatient Days) in 2015 100 74.5 20 9.6 1.9 462 1945 Putlet Capital Personnel tenance created Medicare Medicaid All Other Saint Joseph Hospital (Medicare Provider No. 060028) 1375 East 19th Ave, Denver, CO 80218 (303) 812-2000 www.saintjosephdenver.org Current Licensed Beds: 400 Current Fiscal Year End: December 31 CMS Five Star Rating (2016) Employment Trends Employees on Payroll FTES Total Items & Residents FTES Total FTES Utilization Trends Available Beds Inpatient Discharges Inpatient Days Average Length of Stay Cocupancy Rate (Inpatient Days) Observation Days Financial Trends Gross Patient Revenue Contractual Alowances Net Patient Revenue Total Operating Expenses Salaries and Benefits Other Non Patient Revenue Other Non Patient Expenses Charity Care Bad Debt Unreimbursed Cost for Medicaid 18.477 2011 2,163 99 2,430 2011 370 19,732 84,156 426 62.31% 9.17 2011 1.599,042,483 1.167,102,940 425,929,543 412,798,290 206,567,838 17,150,043 Not Reported 17,445,264 1,904.025 8,983,977 Ownership Type Proprietary Hospital Type Acute Hospital State House District HD 8. Lesie Herod State Senate District SD 33 - Angela Wiliams US Congressional District CD 1. Diana Degete HQIP Score (2016/2017) - Out of 50 31 2012 2013 2014 2015 2,230 2,028 2,123 2,047 97 102 102 102 2.472 2.319 2,475 2.372 2012 2013 2014 2015 355 330 296 356 18,218 18,674 18,487 84,551 85,730 84,154 89.000 4.50 4.71 4.51 4.81 65.07 71.18% 77.89% 68.49% 4,941 3.770 2012 2013 2014 2015 1.714,383.006 1.842,092,973 1,893,392,127 2060 242 349 1.267,816,974 1,379,063.427 1,427 493,662 1.562.062,674 446,566,661 463,009,546 465,838,465 498, 179,675 422,282,942 440,656,911 464,460,546 497,179,084 195,546,970 201.899,146 222,447 244 220.921.826 29,087,710 29 233,178 24,399.667 36.153.803 Not Reported Not Reported Not Reported Not Reported 22,485,589 19,676,430 20,599.792 12 368,545 1,589,91 1.799,665 1.606,507 2.820,538 8,902,192 10.811,507 17.015,964 16.597 307 Patient Service Margin 13,141,253 Total Margin 30,201,206 Patient Service Margin Percent 3.09% Total Margin Percent 6.84% Total Hospital Expenses (%) in 2015 24 283,729 53,321,439 5.44% 11 21 22.352,635 1.377,819 51.585,813 25,717,486 4.89% 0.30% 10.48 5.25% Payer Mix (Inpatient Days) in 2015 1.000,591 37,154394 0.20% 6.95% 60 39.8% 50 30 I..... 20 248% 10 1.7 0 des Other Patient Care Ucenated Maintenance Medicare Medicaid All Other * indicates truncated Cost Report that does not cover an entire fiscal year. "Not Available means that there were not enough data to report the quality measure, while "Not Applicable" indicates the measure did not apply to that facility. Denver Health (Medicare Provider No. 060011) 777 Bannock Street, Denver, CO 80204 (303) 436-6000 www.deverhealth.org Current Licensed Beds: 525 Current Fiscal Year End: December 31 CMS Five Star Rating (2016) 2011 4,488 190 5.247 2011 313 19,860 94,492 4.76 82.71% 9,404 Ownership Type Goverment Local Hospital Type Acute Hospital State House District HD 5. Crisanta Duran State Sense District SD 34. Lucia Guaman US Congressional District CD 1 Diana Degete HQIP Score (2016/2017) - Out of 50 27 2012 2013 2014 4,683 4.657 4,784 187 195 200 5,190 5.111 5.331 2012 2013 2014 337 340 336 19,069 17.708 18.480 99,409 91.009 94.872 4.90 5.14 5.13 75.79% 73.40% 77.38% 5,560 5,693 4.255 2012 2013 2014 1.664,350,302 1,761.615,845 1,878,875,786 1.311.518,311 1284,197.80 1.429,061,543 352,831,991 477 477,947 449,814, 245 848,835,086 918.996.209 975,279,478 477,629,311 491,052,700 509,826,163 502,682,805 423,520,098 571 243,354 Not Reported Not Reported Not Reported 15.760,819 15,064,694 12,562,626 15.846,666 22,312,903 31 364.726 61.154,700 55 361,786 21.852,238 Employment Trends Employees on Payroll FTES Total Inters & Residents FTES Total FTES Utilization Trends Available Beds Inpatient Discharges Inpatient Days Average Length of Stay Cocupancy Rate Inpatient Days) Observation Days Financial Trends Gross Patient Revenue Contractual Alowances Net Patient Revenue Total Operating Expenses Salaries and Bones Other Non Patient Revenue Other Non Patient Expenses Charity Care Bad Debt Unreimbursed Cost for Medicaid Patient Service Margin Total Margin Patient Service Margin Percent Total Margin Porcent 2015 5,144 213 5,673 2015 342 18,770 96,180 5.12 77.05 4.969 2011 1,529,683,465 1,190,963,028 332,700,437 806,668,631 454,770,126 397,096,286 90,107,490 16,528,500 25,542,780 50,312,147 2015 2.058.906.268 1,549.962,799 508.943,529 1,048.604,352 566.652.368 578.565 557 Not Reported 13.795,736 27,770.636 Not Reported -473,968,194 13,235,582 -142.46% 1.81% -496,009,035 6,689,710 -140.58% 0.78% -441,458,25 -17.998,158 -92.46% -1.99% -525,465,239 45,778,121 -116.82% 4.48% -539.750.823 38.814,794 -105.05% 3.57% Total Hospital Expenses (%) in 2015 Payer Mix (Inpatient Days) in 2015 50 12.15 30 21.8 20 18 625% 10 53 0 204% Personnel Admin Capital Patient Care Uncompensated Maintenance Medicare Medical All Other * indicates truncated Cost Report that does not cover an entire fiscal year. "Not Available means that there were not enough data to report the quality measure, while "Not Applicable" indicates the measure did not apply to that facility. Rose Medical Center (Medicare Provider No. 060032) 2011 1,042 29 2011 4557 E 9th Ave., Denver, CO 80220 (303320-2121 www.rosemed.com Current Licensed Beds: 422 Current Fiscal Year End: December 31 CMS Five Star Rating (2016) **** Employment Trends Employees on Payroll FTES Total Items & Residents FTES Total FTES Utilization Trends Available Beda Inpatient Discharges Inpatient Days Average Length of Stay Cocupancy Rate Irpatient Days) Observation Days Financial Trends Gross Patient Revenue Contractual Alowances Net Patient Revenue Total Operating Expenses Salaries and Bones Other Non Patient Revenue Other Non Patient Expenses Charity Care Bad Debt Unreimbursed Cost for Medicaid 12,721 57,228 4.50 61.73% 4,756 2011 1,133,531,341 861,462,717 272,068,624 216,245,421 105,458,594 2,602,798 Not Reported 1,855,449 1,219,049 5,239,513 Ownership Type Proprietary Hospital Type Acute Hospital State House District HD 8 - Leslie Herod State Senate District SD 31. Lois Court US Congressional District CD 1 - Diana Degete HQIP Score (2016/2017) - Out of 50 27 2012 2013 2014 2015 999 1.000 961 28 27 27 27 1,238 1.260 1,136 1146 2012 2013 2014 2015 244 244 183 12,310 12,621 12,192 11.546 54,280 56,110 51.900 49.007 4.39 4.45 4.26 4.24 66.50% 63.00% 58.37% 73.37% 2,665 3,064 3,499 3.450 2012 2013 2014 2015 1217,208,sea 1 349 254,371 1,459,124,249 1.627 995086 947,453,990 1,072,311,432 1.175.183.000 1,338,583,952 269,754,993 278.942,989 283,941 241 289 411,194 201,457,826 202,058,570 196,472,969 190,821 280 107,965,693 110.691.265 102,057,913 107, 126,379 1,005,486 1.206,887 1.257,203 1,217 864 Not Reported Not Reported Not Reported Not Reported 1,753,570 1,330,602 454,516 454,883 1,434,479 2,842,325 783,621 1,655,500 2,935,460 4.140.187 11,357,651 7.424,520 68,297,167 74,884,369 87.468,292 98.589,854 69.392,663 78.091.256 88,725,485 99,807,718 25.32% 27.04% 30.81% 3407 25.62% 27.36% 31.11% 34.34% Payer Mix (Inpatient Days) in 2015 Patient Service Margin 55,823,200 Total Margin 58,425,906 Patient Service Margin Percent 20.52% Total Margin Percent 21 27% Total Hospital Expenses (%) in 2015 100 44.4% 74.3 60 20 2.3 2445 1.1 Personnel Capital 31.2% Admin Patiente Maintenance Uncome Medicare Medicaid All Other
Step by Step Solution
There are 3 Steps involved in it
Step: 1

Get Instant Access to Expert-Tailored Solutions
See step-by-step solutions with expert insights and AI powered tools for academic success
Step: 2

Step: 3
Ace Your Homework with AI
Get the answers you need in no time with our AI-driven, step-by-step assistance
Get Started
Financial Markets And Institutions
Authors: Anthony Saunders, Marcia Cornett
5th Edition
0078034663, 978-0078034664