

Question
Compare the present value of all equity firm and present value of levered firms. Which one is bigger? Why? Sampa Video, Inc. was the second
Compare the present value of all equity firm and present value of levered firms. Which one is bigger? Why?
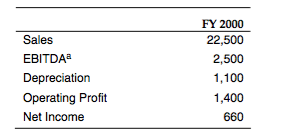
Sampa Video, Inc. was the second largest chain of videocassette rental stores in the greater Boston area, operating 30 wholly owned outlets. Begun in 1988 as a small store in Harvard Square catering mostly to students, the company grew rapidly, primarily due to its reputation for customer service and an extensive selection of foreign and independent movies. These differentiating factors allowed Sampa Video to compete directly with the leader in the industry, Blockbuster Video. But unlike the larger rival, Sampa had no ambitions to grow outside of its Boston territory. Exhibit 1 contains summary financial information on the company as of their latest fiscal year-end.
In March 2001, Sampa Video was considering entering the business of home delivery of movie rentals. The company would set up a web page where customers could choose movies based on available in-store inventory and pick a time for delivery. This would put Sampa in competition with new internet-based competitors, such as Netflix.com that rented DVDs through the mail and Kramer.com and Cityretrieve.com that hand delivered DVDs and videocassettes.
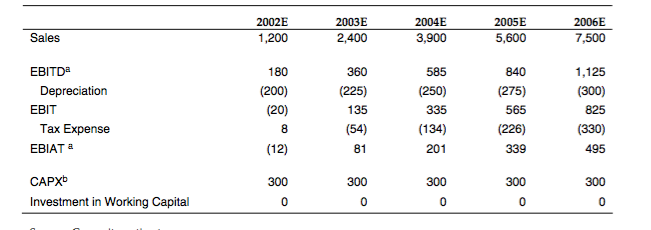
While it was expected that the project would cannibalize the existing operations to some extent, management believed that incremental sales would be substantial in the long run. The project would provide customers the same convenience as internet-based DVD rentals for the wider selection of movies available on videocassettes. Sampa also planned to hand deliver DVDs. The company expected that the project would increase its annual revenue growth rate from 5% to 10% a year over the following 5 years. After that, as the home delivery business matured, the free cash flow would grow at the same 5% long-term rate as the videocassette rental industry as a whole. Exhibit 2 contains managements projections for the expected incremental revenues and cash flows achievable from the project.
Sampa managements major concern was the significant up-front investment required to start the project. This consisted primarily of setting up a network of delivery vehicles and staff, developing the website, and some initial advertising and promotional efforts to make existing customers aware of the new service. Management estimated these costs at $1.5 million, all of which would be incurred in December 2001, as the service would be launched in January 2002.1
Management was debating how to assess the projects debt capacity and the impact of any financing decisions on value. In thinking about how much debt to raise for the project, two options were being considered. The first was to fund a fixed amount of debt, which would either be kept in perpetuity or paid down gradually. The second alternative was to adjust the amount of debt so as to
1 For the purposes of this exercise, it is assumed that all start-up costs would have been capitalized, and depreciated over time. In reality, some of these costs would have been capitalized (e.g., investment in delivery vehicles) while others would have been expensed immediately (e.g., advertising costs).
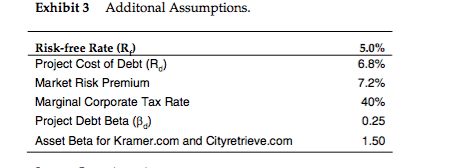
Exhibit 3 Additonal Assumptions Risk-free Rate (R) Project Cost of Debt (R) Market Risk Premium 5.0% 6.8% 72% 40% 0.25 1.50 Project Debt Beta (B) Asset Beta for Kramer.com and Cityretrieve.com FY 2000 22,50() 2,500 1,100 1,400 660 Sales EBITDA Depreciation Operating Profit 2002E 1,200 2004E 3,900 2005E 5,600 2003E 2,400 2006E 7,500 1,125 EBITDa 360 (225) 135 (54) 81 585 (250) 335 (134) 201 840 (275) 565 180 Depreciation EBIT (20) (12) 300 Tax Expense EBIAT a 495 339 Investment in Working Capital 300 300 Exhibit 3 Additonal Assumptions Risk-free Rate (R) Project Cost of Debt (R) Market Risk Premium 5.0% 6.8% 72% 40% 0.25 1.50 Project Debt Beta (B) Asset Beta for Kramer.com and Cityretrieve.com FY 2000 22,50() 2,500 1,100 1,400 660 Sales EBITDA Depreciation Operating Profit 2002E 1,200 2004E 3,900 2005E 5,600 2003E 2,400 2006E 7,500 1,125 EBITDa 360 (225) 135 (54) 81 585 (250) 335 (134) 201 840 (275) 565 180 Depreciation EBIT (20) (12) 300 Tax Expense EBIAT a 495 339 Investment in Working Capital 300 300Step by Step Solution
There are 3 Steps involved in it
Step: 1

Get Instant Access to Expert-Tailored Solutions
See step-by-step solutions with expert insights and AI powered tools for academic success
Step: 2

Step: 3
Ace Your Homework with AI
Get the answers you need in no time with our AI-driven, step-by-step assistance
Get Started
Create Wealth Over The Long Run Give Yourself The Life You Deserve
Authors: Micheal J. Bess
1st Edition
979-8865993711