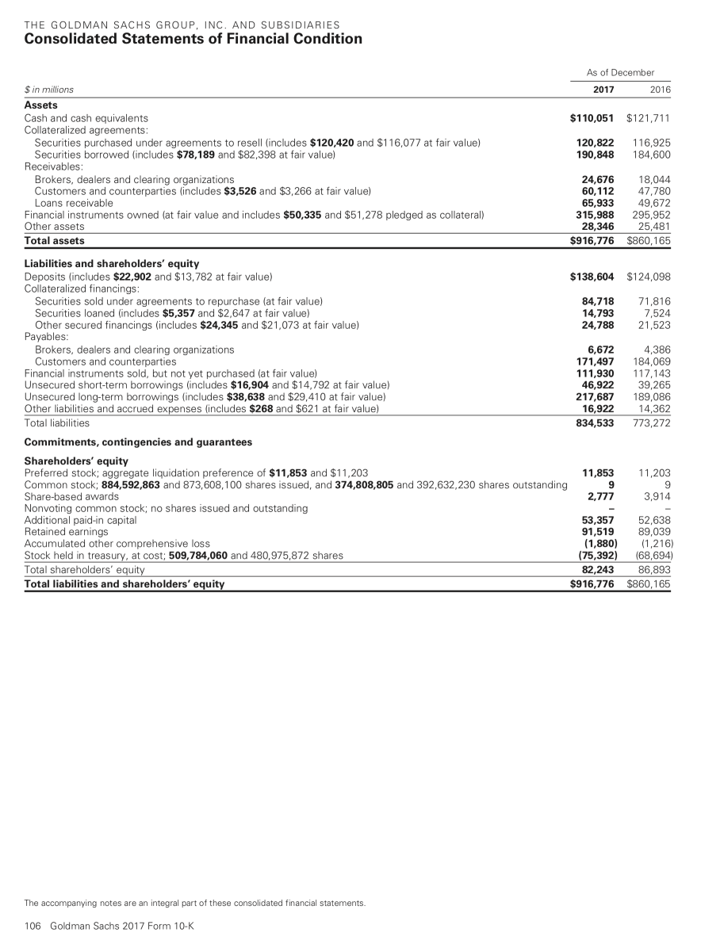
Compare the size of GS' investment portfolios between 2007 and 2017?
1. What are Max VaR for 2007 and 2017?
2. What are the reasons for such change?
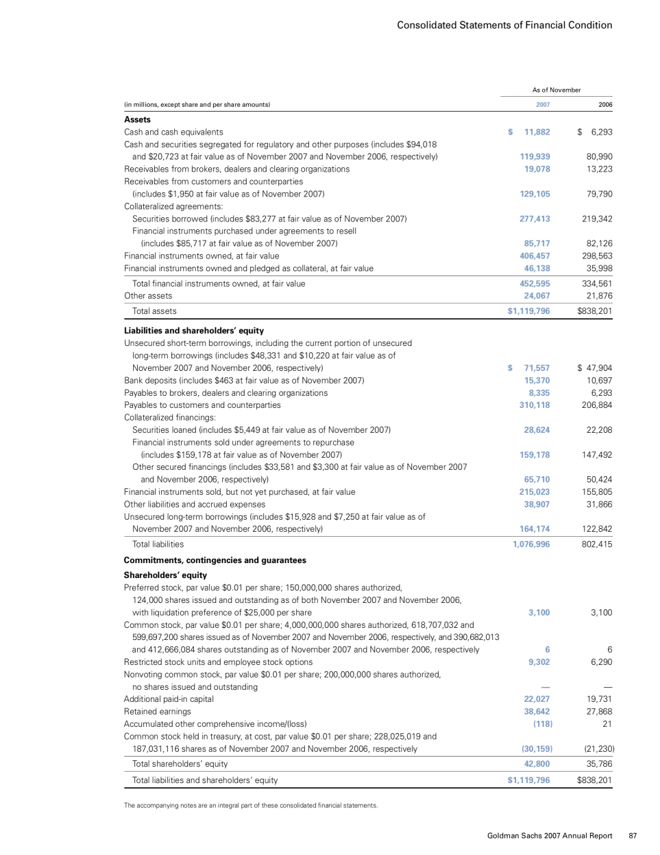
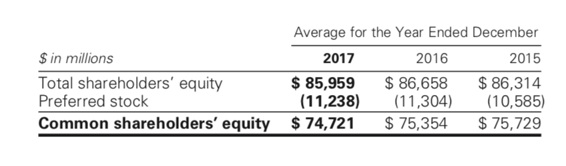
Consolidated Statements of Financial Condition As of November in milions, except share and per share amounts 2005 $ 11.882 $ 6,293 119.939 19,078 80,990 13,223 129,105 79,790 Assets Cash and cash equivalents Cash and securities segregated for regulatory and other purposes includes $94,018 and $20,723 at fair value as of November 2007 and November 2006, respectively! Receivables from brokers, dealers and clearing organizations Receivables from customers and counterparties Includes $1,950 at fair value as of November 2007) Collateralized agreements: Securities borrowed includes $83,277 at fair value as of November 2007) Financial instruments purchased under agreements to resell includes $85,717 at fair value as of November 2007) Financial instruments owned, at fair value Financial instruments owned and pledged as collateral, at fair value Total financial instruments owned, at fair value Other assets 277,413 219,342 85,717 406,457 46,138 452,595 24,067 $1,119,796 82,126 298,563 35,998 334,561 21,876 $838,201 Total assets $ 71,557 15,370 8.335 310, 118 $ 47,904 10.697 6,293 206,884 28,624 22,208 159,178 147.492 65,710 215,023 38,907 50,424 155,805 31.866 164,174 1,076,996 122.842 802.415 Liabilities and shareholders' equity Unsecured short-term borrowings, including the current portion of unsecured long-term borrowings includes $48,331 and $10,220 at fair value as of November 2007 and November 2006, respectively) Bank deposits includes $463 at fair value as of November 2007) Payables to brokers, dealers and clearing organizations Payables to customers and counterparties Collateralized financings: Securities loaned (includes $5,449 at fair value as of November 2007) Financial instruments sold under agreements to repurchase includes $159.178 at fair value as of November 2007 Other secured financings (includes $33,581 and $3,300 at fair value as of November 2007 and November 2006, respectively Financial instruments sold, but not yet purchased, at fair value Other liabilities and accrued expenses Unsecured long-term borrowings (includes $15,928 and $7,250 at fair value as of November 2007 and November 2006, respectively) Total abilities Commitments, contingencies and guarantees Shareholders' equity Preferred stock, par value $0.01 per share; 150,000,000 shares authorized 124,000 shares issued and outstanding as of both November 2007 and November 2006, with liquidation preference of $25,000 per share Common stock, par value $0.01 per share: 4,000,000,000 shares authorized, 618,707,032 and 599,697,200 shares issued as of November 2007 and November 2006, respectively, and 390,682,013 and 412,666,084 shares outstanding as of November 2007 and November 2006, respectively Restricted stock units and employee stock options Nonvoting common stock, par value $0.01 per share: 200,000,000 shares authorized no shares issued and outstanding Additional paid-in capital Retained earnings Accumulated other comprehensive income/lloss) Common stock held in treasury, at cost, par value $0.01 per share; 228.025,019 and 187,031,116 shares as of November 2007 and November 2006, respectively Total shareholders' equity Total liabilities and shareholders' equity 3,100 3,100 9,302 6,290 22,027 38,642 (118) 19,731 27.868 21 (30,159) 42,800 $1,119,796 21,230) 35,786 $838,201 The accompanying notes are an integral part of these consolidated financial statements Goldman Sachs 2007 Annual Report 87 Consolidated Statements of Earnings Year Ended November fin milions, except per share amounts 2005 Revenues Investment banking Trading and principal investments Asset management and securities services Interest income Total revenues Interest expense $ 7,555 29,714 4,731 45,968 87,968 41.981 45,987 $ 5,613 24.027 4,527 35,186 69,353 31.688 37.665 $ 3,599 15,452 3,090 21,250 43,391 18,153 25.238 16.457 1.985 492 544 20,190 2.758 601 665 624 195 975 714 335 1,326 11,758 1416 378 490 501 124 521 173 850 545 728 Revenues, not of interest expense Operating expenses Compensation and benefits Brokerage, clearing, exchange and distribution fees Market development Communications and technology Depreciation and amortization Amortization of identifiable intangible assets Occupancy Professional fees Cost of power generation Other expenses Total non-compensation expenses Total operating expenses Pre-tax camings Provision for taxes Net earnings Preferred stock dividends Net earnings applicable to common shareholders Earnings per common share Basic Diluted Average common shares outstanding Basic Diluted 8,193 28,383 17,604 6.005 11.599 192 $11,407 1.132 6,648 23.105 14,560 5,023 9.537 139 $9,398 475 386 709 5,207 16.965 8.273 2,647 5,626 $ 5,609 $ 26,34 24.73 $ 20.93 19.69 $ 11.73 11.21 433.0 461.2 449.0 477.4 478.1 5002 THE GOLDMAN SACHS GROUP, INC. AND SUBSIDIARIES Consolidated Statements of Financial Condition As of December 2017 2016 $110,051 $121,711 120,822 190,848 116,925 184,600 Sin millions Assets Cash and cash equivalents Collateralized agreements: Securities purchased under agreements to resell (includes $120,420 and $116,077 at fair value) Securities borrowed includes $78,189 and $82,398 at fair value) Receivables: Brokers, dealers and clearing organizations Customers and counterparties includes $3,526 and $3,266 at fair value) Loans receivable Financial instruments owned (at fair value and includes $50,335 and $51,278 pledged as collateral) Other assets Total assets 24,676 60,112 65,933 315,988 28,346 $916,776 18,044 47.780 49,672 295,952 25,481 $860,165 $124,098 71,816 7,524 21,523 Liabilities and shareholders' equity Deposits (includes $22,902 and $13,782 at fair value) $138,604 Collateralized financings: Securities sold under agreements to repurchase (at fair value) 84,718 Securities loaned (includes $5,357 and $2,647 at fair value) 14,793 Other secured financings (includes $24,345 and $21,073 at fair value) 24,788 Payables: Brokers, dealers and clearing organizations 6,672 Customers and counterparties 171,497 Financial instruments sold, but not yet purchased (at fair value) 111,930 Unsecured short-term borrowings (includes $16,904 and $14,792 at fair value) 46,922 Unsecured long-term borrowings (includes $38,638 and $29,410 at fair value) 217,687 Other liabilities and accrued expenses includes $268 and $621 at fair value) 16,922 Total liabilities 834,533 Commitments, contingencies and guarantees Shareholders' equity Preferred stock; aggregate liquidation preference of $11,853 and $11,203 11,853 Common stock: 884,592,863 and 873,608,100 shares issued, and 374,808,805 and 392,632,230 shares outstanding 9 Share-based awards 2,777 Nonvoting common stock; no shares issued and outstanding Additional paid-in capital 53,357 Retained earnings 91,519 Accumulated other comprehensive loss (1,880) Stock held in treasury, at cost: 509,784,060 and 480,975,872 shares (75,392) Total shareholders' equity 82,243 Total liabilities and shareholders' equity $916,776 4,386 184,069 117,143 39,265 189,086 14,362 773,272 11,203 3,914 52,638 89,039 (1,216) (68,694) 86,893 $860,165 The accompanying notes are an integral part of these consolidated financial statements. 106 Goldman Sachs 2017 Form 10-K THE GOLDMAN SACHS GROUP, INC. AND SUBSIDIARIES Consolidated Statements of Earnings Year Ended December 2017 2016 2015 in millions, except per share amounts Revenues Investment banking Investment management Commissions and fees Market making Other principal transactions Total non-interest revenues $ 7,371 $ 6,273 5,803 5,407 3,051 3,208 7,660 9,933 5,256 3,200 29,141 28,021 13,113 9,691 10,1817 .104 2,932 2,587 32,073 30,608 $ 7,027 5,868 3,320 9,523 5,018 30,756 8,452 5,388 3,064 33,820 Interest income Interest expense Net interest income Net revenues, including net interest income Operating expenses Compensation and benefits Brokerage, clearing, exchange and distribution fees Market development Communications and technology Depreciation and amortization Occupancy Professional fees Other expenses Total non-compensation expenses Total operating expenses 11,853 2,540 588 897 1,152 733 965 2,213 9,088 20,941 11,647 2,555 457 809 998 788 882 2,168 8,657 20,304 12,678 2,576 557 806 991 772 963 5,699 12,364 25,042 Pre-tax earnings Provision for taxes Net earnings Preferred stock dividends Net earnings applicable to common shareholders 11,132 6,846 4,286 601 $ 3,685 10,304 2,906 7,398 311 $ 7,087 8,778 2,695 6,083 515 $ 5,568 $ $ 9.12 9.01 $ 16.53 $ 16.29 $ 12.35 $12.14 Earnings per common share Basic Diluted Average common shares Basic Diluted 401.6 409. 1 427.4 435. 1 448.9 458.6 $ in millions Total shareholders' equity Preferred stock Common shareholders' equity Average for the Year Ended December 2017 2016 2015 $ 85,959 $ 86,658 $ 86,314 (11,238) (11,304) (10,585) $ 74,721 $ 75,354 $ 75,729 Consolidated Statements of Financial Condition As of November in milions, except share and per share amounts 2005 $ 11.882 $ 6,293 119.939 19,078 80,990 13,223 129,105 79,790 Assets Cash and cash equivalents Cash and securities segregated for regulatory and other purposes includes $94,018 and $20,723 at fair value as of November 2007 and November 2006, respectively! Receivables from brokers, dealers and clearing organizations Receivables from customers and counterparties Includes $1,950 at fair value as of November 2007) Collateralized agreements: Securities borrowed includes $83,277 at fair value as of November 2007) Financial instruments purchased under agreements to resell includes $85,717 at fair value as of November 2007) Financial instruments owned, at fair value Financial instruments owned and pledged as collateral, at fair value Total financial instruments owned, at fair value Other assets 277,413 219,342 85,717 406,457 46,138 452,595 24,067 $1,119,796 82,126 298,563 35,998 334,561 21,876 $838,201 Total assets $ 71,557 15,370 8.335 310, 118 $ 47,904 10.697 6,293 206,884 28,624 22,208 159,178 147.492 65,710 215,023 38,907 50,424 155,805 31.866 164,174 1,076,996 122.842 802.415 Liabilities and shareholders' equity Unsecured short-term borrowings, including the current portion of unsecured long-term borrowings includes $48,331 and $10,220 at fair value as of November 2007 and November 2006, respectively) Bank deposits includes $463 at fair value as of November 2007) Payables to brokers, dealers and clearing organizations Payables to customers and counterparties Collateralized financings: Securities loaned (includes $5,449 at fair value as of November 2007) Financial instruments sold under agreements to repurchase includes $159.178 at fair value as of November 2007 Other secured financings (includes $33,581 and $3,300 at fair value as of November 2007 and November 2006, respectively Financial instruments sold, but not yet purchased, at fair value Other liabilities and accrued expenses Unsecured long-term borrowings (includes $15,928 and $7,250 at fair value as of November 2007 and November 2006, respectively) Total abilities Commitments, contingencies and guarantees Shareholders' equity Preferred stock, par value $0.01 per share; 150,000,000 shares authorized 124,000 shares issued and outstanding as of both November 2007 and November 2006, with liquidation preference of $25,000 per share Common stock, par value $0.01 per share: 4,000,000,000 shares authorized, 618,707,032 and 599,697,200 shares issued as of November 2007 and November 2006, respectively, and 390,682,013 and 412,666,084 shares outstanding as of November 2007 and November 2006, respectively Restricted stock units and employee stock options Nonvoting common stock, par value $0.01 per share: 200,000,000 shares authorized no shares issued and outstanding Additional paid-in capital Retained earnings Accumulated other comprehensive income/lloss) Common stock held in treasury, at cost, par value $0.01 per share; 228.025,019 and 187,031,116 shares as of November 2007 and November 2006, respectively Total shareholders' equity Total liabilities and shareholders' equity 3,100 3,100 9,302 6,290 22,027 38,642 (118) 19,731 27.868 21 (30,159) 42,800 $1,119,796 21,230) 35,786 $838,201 The accompanying notes are an integral part of these consolidated financial statements Goldman Sachs 2007 Annual Report 87 Consolidated Statements of Earnings Year Ended November fin milions, except per share amounts 2005 Revenues Investment banking Trading and principal investments Asset management and securities services Interest income Total revenues Interest expense $ 7,555 29,714 4,731 45,968 87,968 41.981 45,987 $ 5,613 24.027 4,527 35,186 69,353 31.688 37.665 $ 3,599 15,452 3,090 21,250 43,391 18,153 25.238 16.457 1.985 492 544 20,190 2.758 601 665 624 195 975 714 335 1,326 11,758 1416 378 490 501 124 521 173 850 545 728 Revenues, not of interest expense Operating expenses Compensation and benefits Brokerage, clearing, exchange and distribution fees Market development Communications and technology Depreciation and amortization Amortization of identifiable intangible assets Occupancy Professional fees Cost of power generation Other expenses Total non-compensation expenses Total operating expenses Pre-tax camings Provision for taxes Net earnings Preferred stock dividends Net earnings applicable to common shareholders Earnings per common share Basic Diluted Average common shares outstanding Basic Diluted 8,193 28,383 17,604 6.005 11.599 192 $11,407 1.132 6,648 23.105 14,560 5,023 9.537 139 $9,398 475 386 709 5,207 16.965 8.273 2,647 5,626 $ 5,609 $ 26,34 24.73 $ 20.93 19.69 $ 11.73 11.21 433.0 461.2 449.0 477.4 478.1 5002 THE GOLDMAN SACHS GROUP, INC. AND SUBSIDIARIES Consolidated Statements of Financial Condition As of December 2017 2016 $110,051 $121,711 120,822 190,848 116,925 184,600 Sin millions Assets Cash and cash equivalents Collateralized agreements: Securities purchased under agreements to resell (includes $120,420 and $116,077 at fair value) Securities borrowed includes $78,189 and $82,398 at fair value) Receivables: Brokers, dealers and clearing organizations Customers and counterparties includes $3,526 and $3,266 at fair value) Loans receivable Financial instruments owned (at fair value and includes $50,335 and $51,278 pledged as collateral) Other assets Total assets 24,676 60,112 65,933 315,988 28,346 $916,776 18,044 47.780 49,672 295,952 25,481 $860,165 $124,098 71,816 7,524 21,523 Liabilities and shareholders' equity Deposits (includes $22,902 and $13,782 at fair value) $138,604 Collateralized financings: Securities sold under agreements to repurchase (at fair value) 84,718 Securities loaned (includes $5,357 and $2,647 at fair value) 14,793 Other secured financings (includes $24,345 and $21,073 at fair value) 24,788 Payables: Brokers, dealers and clearing organizations 6,672 Customers and counterparties 171,497 Financial instruments sold, but not yet purchased (at fair value) 111,930 Unsecured short-term borrowings (includes $16,904 and $14,792 at fair value) 46,922 Unsecured long-term borrowings (includes $38,638 and $29,410 at fair value) 217,687 Other liabilities and accrued expenses includes $268 and $621 at fair value) 16,922 Total liabilities 834,533 Commitments, contingencies and guarantees Shareholders' equity Preferred stock; aggregate liquidation preference of $11,853 and $11,203 11,853 Common stock: 884,592,863 and 873,608,100 shares issued, and 374,808,805 and 392,632,230 shares outstanding 9 Share-based awards 2,777 Nonvoting common stock; no shares issued and outstanding Additional paid-in capital 53,357 Retained earnings 91,519 Accumulated other comprehensive loss (1,880) Stock held in treasury, at cost: 509,784,060 and 480,975,872 shares (75,392) Total shareholders' equity 82,243 Total liabilities and shareholders' equity $916,776 4,386 184,069 117,143 39,265 189,086 14,362 773,272 11,203 3,914 52,638 89,039 (1,216) (68,694) 86,893 $860,165 The accompanying notes are an integral part of these consolidated financial statements. 106 Goldman Sachs 2017 Form 10-K THE GOLDMAN SACHS GROUP, INC. AND SUBSIDIARIES Consolidated Statements of Earnings Year Ended December 2017 2016 2015 in millions, except per share amounts Revenues Investment banking Investment management Commissions and fees Market making Other principal transactions Total non-interest revenues $ 7,371 $ 6,273 5,803 5,407 3,051 3,208 7,660 9,933 5,256 3,200 29,141 28,021 13,113 9,691 10,1817 .104 2,932 2,587 32,073 30,608 $ 7,027 5,868 3,320 9,523 5,018 30,756 8,452 5,388 3,064 33,820 Interest income Interest expense Net interest income Net revenues, including net interest income Operating expenses Compensation and benefits Brokerage, clearing, exchange and distribution fees Market development Communications and technology Depreciation and amortization Occupancy Professional fees Other expenses Total non-compensation expenses Total operating expenses 11,853 2,540 588 897 1,152 733 965 2,213 9,088 20,941 11,647 2,555 457 809 998 788 882 2,168 8,657 20,304 12,678 2,576 557 806 991 772 963 5,699 12,364 25,042 Pre-tax earnings Provision for taxes Net earnings Preferred stock dividends Net earnings applicable to common shareholders 11,132 6,846 4,286 601 $ 3,685 10,304 2,906 7,398 311 $ 7,087 8,778 2,695 6,083 515 $ 5,568 $ $ 9.12 9.01 $ 16.53 $ 16.29 $ 12.35 $12.14 Earnings per common share Basic Diluted Average common shares Basic Diluted 401.6 409. 1 427.4 435. 1 448.9 458.6 $ in millions Total shareholders' equity Preferred stock Common shareholders' equity Average for the Year Ended December 2017 2016 2015 $ 85,959 $ 86,658 $ 86,314 (11,238) (11,304) (10,585) $ 74,721 $ 75,354 $ 75,729