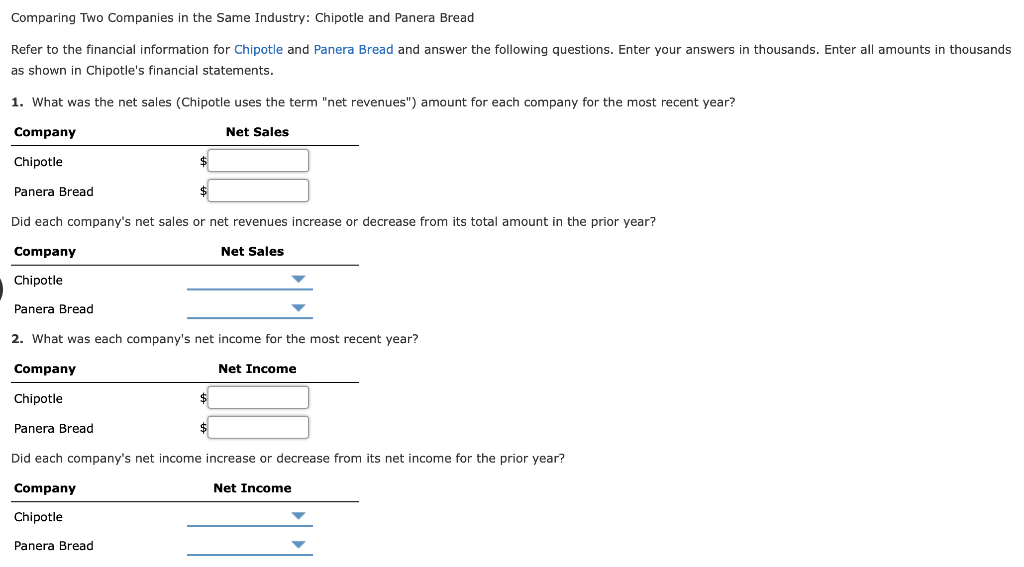
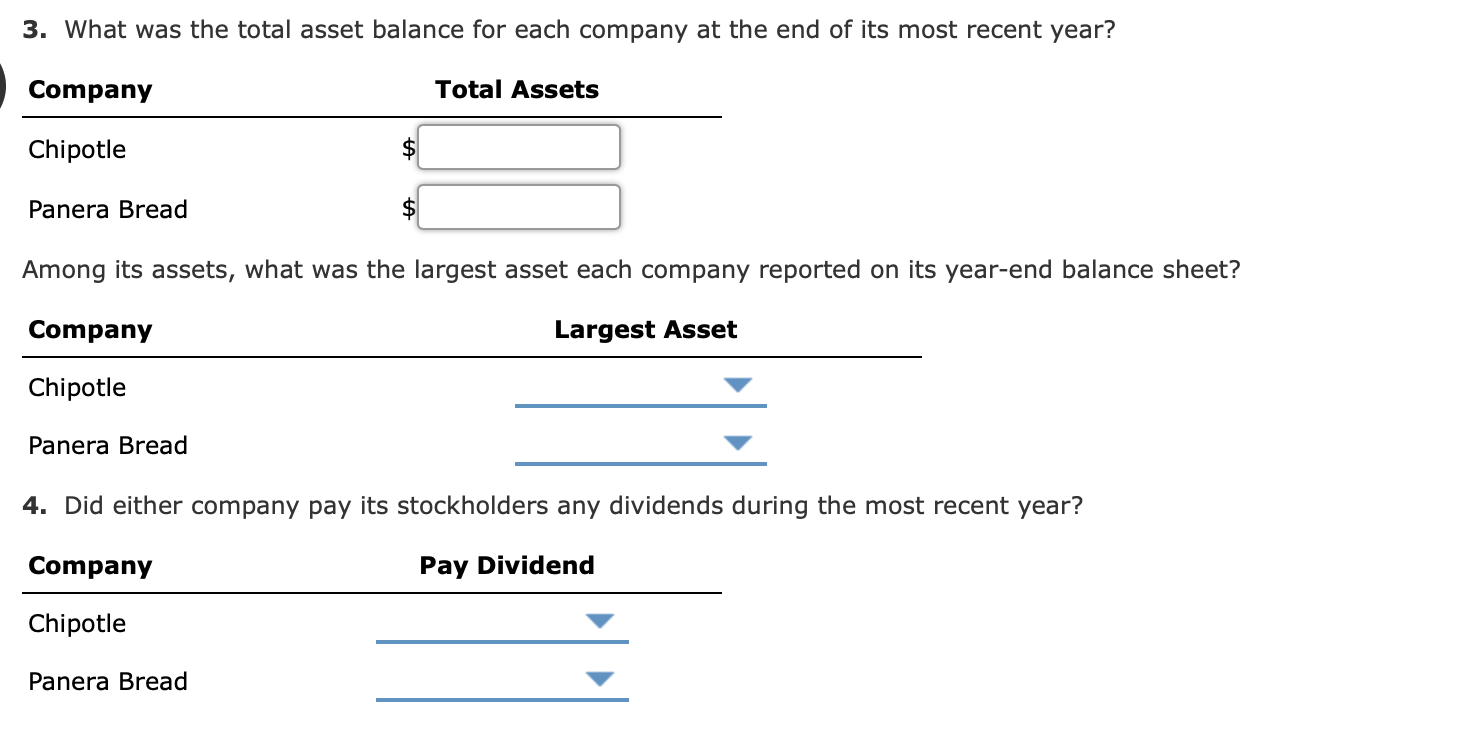
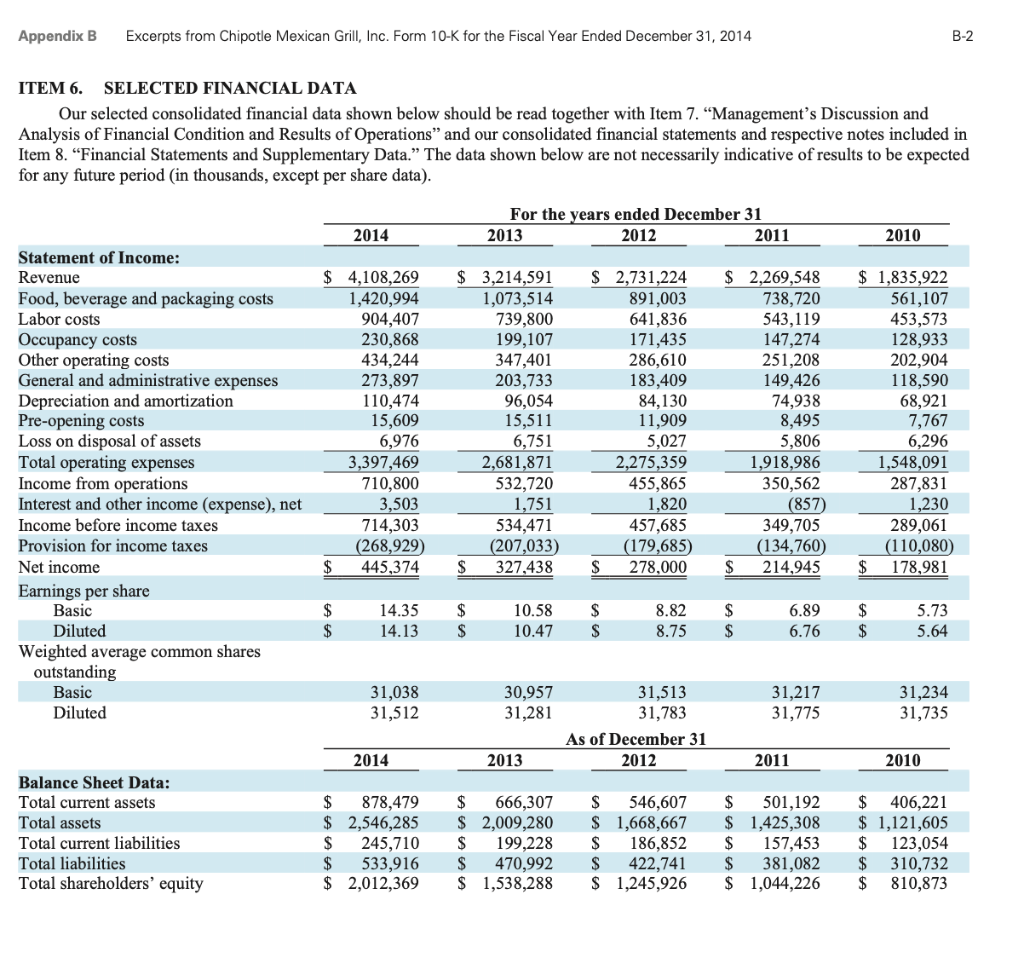
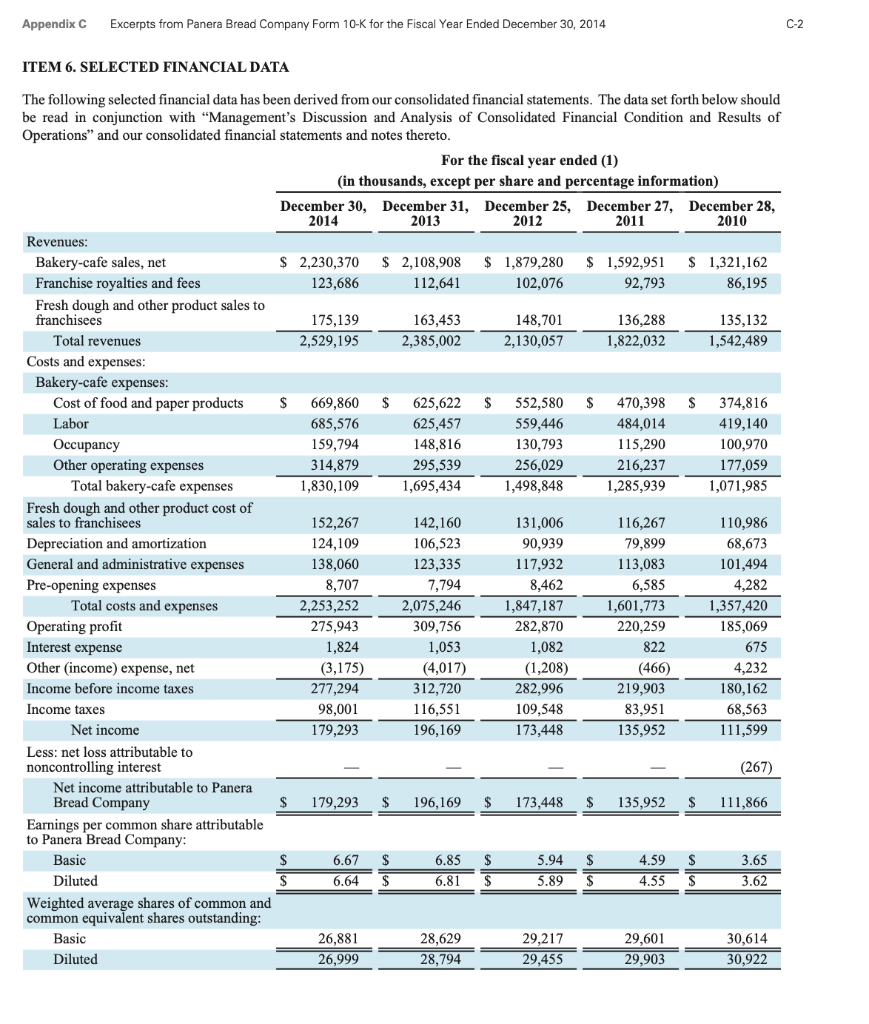
Comparing Two Companies in the Same Industry: Chipotle and Panera Bread Refer to the financial information for Chipotle and Panera Bread and answer the following questions. Enter your answers in thousands. Enter all amounts in thousands as shown in Chipotle's financial statements. 1. What was the net sales (Chipotle uses the term "net revenues") amount for each company for the most recent year? Company Net Sales Chipotle Panera Bread $ Did each company's net sales or net revenues increase or decrease from its total amount in the prior year? Company Net Sales Chipotle Panera Bread 2. What was each company's net income for the most recent year? Company Net Income Chipotle Panera Bread Did each company's net income increase or decrease from its net income for the prior year? Company Net Income Chipotle Panera Bread 3. What was the total asset balance for each company at the end of its most recent year? Company Total Assets Chipotle Panera Bread Among its assets, what was the largest asset each company reported on its year-end balance sheet? Company Largest Asset Chipotle Panera Bread 4. Did either company pay its stockholders any dividends during the most recent year? Company Pay Dividend Chipotle Panera Bread Appendix B Excerpts from Chipotle Mexican Grill, Inc. Form 10-K for the Fiscal Year Ended December 31, 2014 B-2 ITEM 6. SELECTED FINANCIAL DATA Our selected consolidated financial data shown below should be read together with Item 7. "Management's Discussion and Analysis of Financial Condition and Results of Operations and our consolidated financial statements and respective notes included in Item 8. Financial Statements and Supplementary Data. The data shown below are not necessarily indicative of results to be expected for any future period (in thousands, except per share data). For the years ended December 31 2013 2012 2011 2014 2010 Statement of Income: Revenue Food, beverage and packaging costs Labor costs Occupancy costs Other operating costs General and administrative expenses Depreciation and amortization Pre-opening costs Loss on disposal of assets Total operating expenses Income from operations Interest and other income (expense), net Income before income taxes Provision for income taxes Net income Earnings per share Basic Diluted Weighted average common shares outstanding Basic Diluted $ 4,108,269 1,420,994 904,407 230,868 434,244 273,897 110,474 15,609 6,976 3,397,469 710,800 3,503 714,303 (268,929 445,374 $ 3,214,591 1,073,514 739,800 199,107 347,401 203,733 96,054 15,511 6,751 2,681,87 532,720 1,751 534,471 (207,033) $ 327,438 $ 2,731,224 891,003 641,836 171,435 286,610 183,409 84,130 11,909 5,027 2,275,359 455,865 1,820 457,685 (179,685) $ 278,000 $ 2,269,548 738,720 543,119 147,274 251,208 149,426 74,938 8,495 5,806 1,918,986 350,562 (857) 349,705 (134,760) $ 214,945 $ 1,835,922 561,107 453,573 128,933 202,904 118,590 68,921 7,767 6,296 1,548,091 287,831 1,230 289,061 (110,080 $ 178,981 SA $ $ $ 14.35 14.13 $ $ 10.58 10.47 S $ 8.82 8.75 $ $ 6.89 6.76 5.73 5.64 $ 31,038 31,512 30,957 31,281 31,217 31,775 31,234 31,735 31,513 31,783 As of December 31 2012 2014 2013 2011 2010 Balance Sheet Data: Total current assets Total assets Total current liabilities Total liabilities Total shareholders' equity $ 878,479 $ 2,546,285 $ 245,710 $ 533,916 $ 2,012,369 $ 666,307 $ 2,009,280 $ 199,228 $ 470,992 $ 1,538,288 S 546,607 $ 1,668,667 $ 186,852 $ 422,741 $ 1,245,926 $ 501,192 $ 1,425,308 157,453 $ 381,082 $ 1,044,226 $ $ 406,221 $ 1,121,605 $ 123,054 $ 310,732 $ 810,873 Appendix C Excerpts from Panera Bread Company Form 10-K for the Fiscal Year Ended December 30, 2014 C-2 ITEM 6. SELECTED FINANCIAL DATA $ The following selected financial data has been derived from our consolidated financial statements. The data set forth below should be read in conjunction with Management's Discussion and Analysis of Consolidated Financial Condition and Results of Operations" and our consolidated financial statements and notes thereto. For the fiscal year ended (1) (in thousands, except per share and percentage information) December 30, December 31, December 25, December 27, December 28, 2014 2013 2012 2011 2010 Revenues: Bakery-cafe sales, net $ 2,230,370 $ 2,108,908 $ 1,879,280 $ 1,592,951 $ 1,321,162 Franchise royalties and fees 123,686 112,641 102,076 92,793 86,195 Fresh dough and other product sales to franchisees 175,139 163,453 148,701 136,288 135,132 Total revenues 2,529,195 2,385,002 2,130,057 1,822,032 1,542,489 Costs and expenses: Bakery-cafe expenses: Cost of food and paper products S 669,860 $ 625,622 552,580 $ 470,398 S 374,816 Labor 685,576 625,457 559,446 484,014 419,140 Occupancy 159,794 148,816 130.793 115,290 100,970 Other operating expenses 314,879 295,539 256,029 216,237 177,059 Total bakery-cafe expenses 1,830,109 1,695,434 1,498,848 1,285,939 1,071,985 Fresh dough and other product cost of sales to franchisees 152,267 142,160 131,006 116,267 110,986 Depreciation and amortization 124,109 106,523 90,939 79,899 68,673 General and administrative expenses 138,060 123,335 117,932 113,083 101,494 Pre-opening expenses 8,707 7,794 8,462 6,585 4,282 Total costs and expenses 2,253,252 2,075,246 1,847,187 1,601,773 1,357,420 Operating profit 275,943 309,756 282,870 220,259 185,069 Interest expense 1,824 1,053 1,082 822 675 Other (income) expense, net (3,175) (4,017) (1,208) 4,232 Income before income taxes 277,294 312,720 282,996 219,903 180,162 Income taxes 98,001 116,551 109,548 83,951 68,563 Net income 179,293 196,169 173,448 135,952 111,599 Less: net loss attributable to noncontrolling interest (267) Net income attributable to Panera Bread Company S 179,293 $ 196,169 $ 173,448 $ 135,952 111,866 Earnings per common share attributable to Panera Bread Company: Basic 6.67 6.85 $ 5.94 4.59 3.65 Diluted 6.64 6.81 S 5.89 $ 4.55 3.62 Weighted average shares of common and common equivalent shares outstanding: Basic 26,881 28,629 29,217 29,601 30,614 Diluted 26,999 28,794 29,455 29,903 30,922 (466) Comparing Two Companies in the Same Industry: Chipotle and Panera Bread Refer to the financial information for Chipotle and Panera Bread and answer the following questions. Enter your answers in thousands. Enter all amounts in thousands as shown in Chipotle's financial statements. 1. What was the net sales (Chipotle uses the term "net revenues") amount for each company for the most recent year? Company Net Sales Chipotle Panera Bread $ Did each company's net sales or net revenues increase or decrease from its total amount in the prior year? Company Net Sales Chipotle Panera Bread 2. What was each company's net income for the most recent year? Company Net Income Chipotle Panera Bread Did each company's net income increase or decrease from its net income for the prior year? Company Net Income Chipotle Panera Bread 3. What was the total asset balance for each company at the end of its most recent year? Company Total Assets Chipotle Panera Bread Among its assets, what was the largest asset each company reported on its year-end balance sheet? Company Largest Asset Chipotle Panera Bread 4. Did either company pay its stockholders any dividends during the most recent year? Company Pay Dividend Chipotle Panera Bread Appendix B Excerpts from Chipotle Mexican Grill, Inc. Form 10-K for the Fiscal Year Ended December 31, 2014 B-2 ITEM 6. SELECTED FINANCIAL DATA Our selected consolidated financial data shown below should be read together with Item 7. "Management's Discussion and Analysis of Financial Condition and Results of Operations and our consolidated financial statements and respective notes included in Item 8. Financial Statements and Supplementary Data. The data shown below are not necessarily indicative of results to be expected for any future period (in thousands, except per share data). For the years ended December 31 2013 2012 2011 2014 2010 Statement of Income: Revenue Food, beverage and packaging costs Labor costs Occupancy costs Other operating costs General and administrative expenses Depreciation and amortization Pre-opening costs Loss on disposal of assets Total operating expenses Income from operations Interest and other income (expense), net Income before income taxes Provision for income taxes Net income Earnings per share Basic Diluted Weighted average common shares outstanding Basic Diluted $ 4,108,269 1,420,994 904,407 230,868 434,244 273,897 110,474 15,609 6,976 3,397,469 710,800 3,503 714,303 (268,929 445,374 $ 3,214,591 1,073,514 739,800 199,107 347,401 203,733 96,054 15,511 6,751 2,681,87 532,720 1,751 534,471 (207,033) $ 327,438 $ 2,731,224 891,003 641,836 171,435 286,610 183,409 84,130 11,909 5,027 2,275,359 455,865 1,820 457,685 (179,685) $ 278,000 $ 2,269,548 738,720 543,119 147,274 251,208 149,426 74,938 8,495 5,806 1,918,986 350,562 (857) 349,705 (134,760) $ 214,945 $ 1,835,922 561,107 453,573 128,933 202,904 118,590 68,921 7,767 6,296 1,548,091 287,831 1,230 289,061 (110,080 $ 178,981 SA $ $ $ 14.35 14.13 $ $ 10.58 10.47 S $ 8.82 8.75 $ $ 6.89 6.76 5.73 5.64 $ 31,038 31,512 30,957 31,281 31,217 31,775 31,234 31,735 31,513 31,783 As of December 31 2012 2014 2013 2011 2010 Balance Sheet Data: Total current assets Total assets Total current liabilities Total liabilities Total shareholders' equity $ 878,479 $ 2,546,285 $ 245,710 $ 533,916 $ 2,012,369 $ 666,307 $ 2,009,280 $ 199,228 $ 470,992 $ 1,538,288 S 546,607 $ 1,668,667 $ 186,852 $ 422,741 $ 1,245,926 $ 501,192 $ 1,425,308 157,453 $ 381,082 $ 1,044,226 $ $ 406,221 $ 1,121,605 $ 123,054 $ 310,732 $ 810,873 Appendix C Excerpts from Panera Bread Company Form 10-K for the Fiscal Year Ended December 30, 2014 C-2 ITEM 6. SELECTED FINANCIAL DATA $ The following selected financial data has been derived from our consolidated financial statements. The data set forth below should be read in conjunction with Management's Discussion and Analysis of Consolidated Financial Condition and Results of Operations" and our consolidated financial statements and notes thereto. For the fiscal year ended (1) (in thousands, except per share and percentage information) December 30, December 31, December 25, December 27, December 28, 2014 2013 2012 2011 2010 Revenues: Bakery-cafe sales, net $ 2,230,370 $ 2,108,908 $ 1,879,280 $ 1,592,951 $ 1,321,162 Franchise royalties and fees 123,686 112,641 102,076 92,793 86,195 Fresh dough and other product sales to franchisees 175,139 163,453 148,701 136,288 135,132 Total revenues 2,529,195 2,385,002 2,130,057 1,822,032 1,542,489 Costs and expenses: Bakery-cafe expenses: Cost of food and paper products S 669,860 $ 625,622 552,580 $ 470,398 S 374,816 Labor 685,576 625,457 559,446 484,014 419,140 Occupancy 159,794 148,816 130.793 115,290 100,970 Other operating expenses 314,879 295,539 256,029 216,237 177,059 Total bakery-cafe expenses 1,830,109 1,695,434 1,498,848 1,285,939 1,071,985 Fresh dough and other product cost of sales to franchisees 152,267 142,160 131,006 116,267 110,986 Depreciation and amortization 124,109 106,523 90,939 79,899 68,673 General and administrative expenses 138,060 123,335 117,932 113,083 101,494 Pre-opening expenses 8,707 7,794 8,462 6,585 4,282 Total costs and expenses 2,253,252 2,075,246 1,847,187 1,601,773 1,357,420 Operating profit 275,943 309,756 282,870 220,259 185,069 Interest expense 1,824 1,053 1,082 822 675 Other (income) expense, net (3,175) (4,017) (1,208) 4,232 Income before income taxes 277,294 312,720 282,996 219,903 180,162 Income taxes 98,001 116,551 109,548 83,951 68,563 Net income 179,293 196,169 173,448 135,952 111,599 Less: net loss attributable to noncontrolling interest (267) Net income attributable to Panera Bread Company S 179,293 $ 196,169 $ 173,448 $ 135,952 111,866 Earnings per common share attributable to Panera Bread Company: Basic 6.67 6.85 $ 5.94 4.59 3.65 Diluted 6.64 6.81 S 5.89 $ 4.55 3.62 Weighted average shares of common and common equivalent shares outstanding: Basic 26,881 28,629 29,217 29,601 30,614 Diluted 26,999 28,794 29,455 29,903 30,922 (466)