

Question
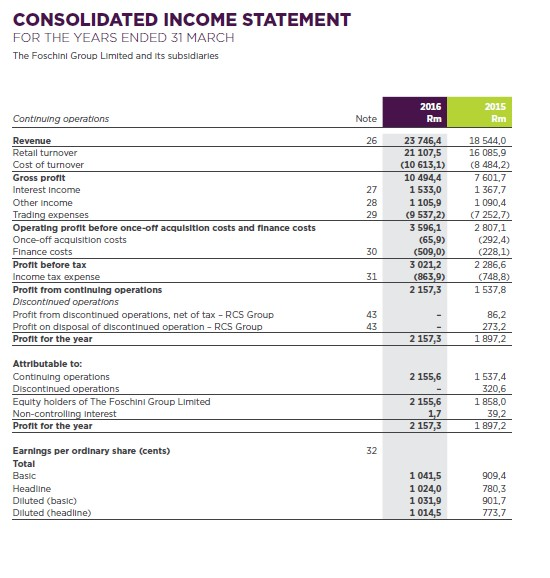
Compile a common size vertical and horizontal income statement and answer the following questions. Only compile the analysis up to Profit for the year .
Compile a common size vertical and horizontal income statement and answer the following questions. Only compile the analysis up to "Profit for the year" .
(Please note, the Revenue of R 23 746.40 in 2016 and R 18 544.00 in 2015 as per the attached income statement is merely a summary of the retail turnover+ interest income + other income. Do not use it as the turnover number)
Comment on the following (Support your answer with ratio calculations and analyses)
a) Gross profit (3 marks)
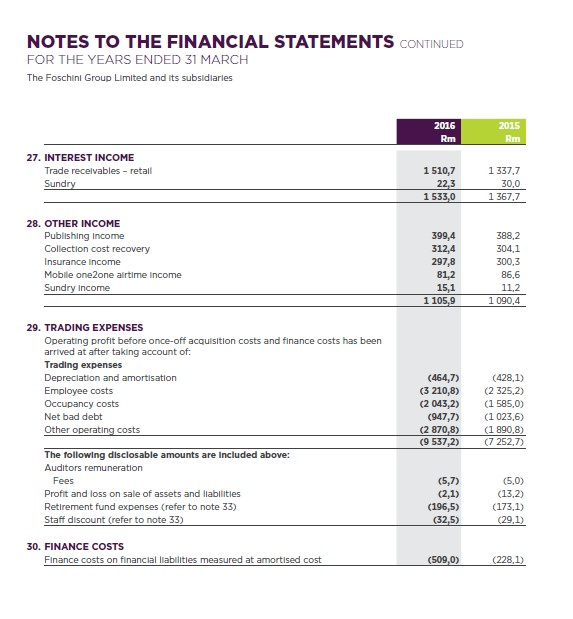
b) trading expense (9 marks)
c) Profit before tax ( 3 marks)
d) Return on investments (6 marks)
e) Return on total assets ( 6 marks)
f) Return on total equity (3 marks)
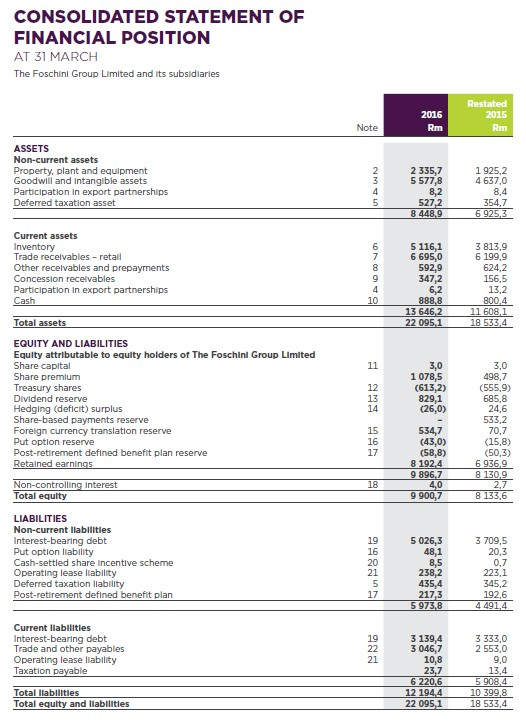
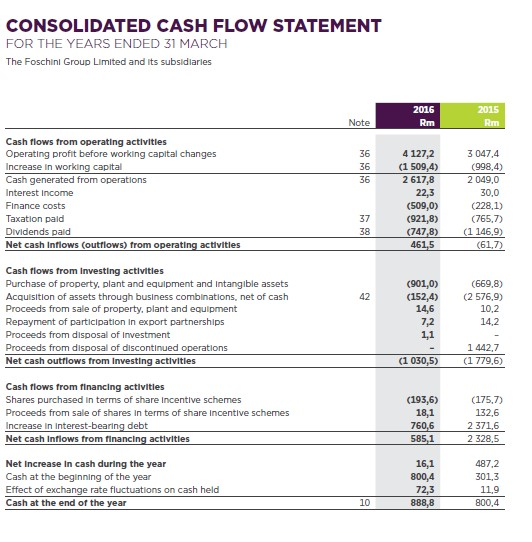
CONSOLIDATED STATEMENT OF FINANCIAL POSITION AT 31 MARCH The Foschini Group Limited and its subsidiaries 2016 Rm Restated 2015 Rm Note ASSETS Non-current assets Property, plant and equipment Goodwill and intangible assets Participation in export partnerships Deferred taxation asset 2 335,7 5 577,8 UTAN 8,2 1925.2 4 637,0 8,4 354,7 6 925,3 527,2 8 448,9 Current assets Inventory Trade receivables - retail Other receivables and prepayments Concession receivables Participation in export partnerships Cash 7 8 9 4 10 5 116,1 6 695,0 592,9 347,2 6,2 3 813,9 6 199,9 624,2 156,5 13,2 800,4 11 608,1 18 533,4 888.8 13 646,2 22 095,1 11 Total assets EQUITY AND LIABILITIES Equity attributable to equity holders of The Foschini Group Limited Share capital Share premium Treasury shares Dividend reserve Hedging (deficit) surplus Share-based payments reserve Foreign currency translation reserve Put option reserve Post-retirement defined benefit plan reserve Retained earnings Non-controlling Interest Total equity 12 13 14 3,0 1 078,5 (613,2) 829,1 (26,0) 15 16 17 534,7 (43,0) (58,8) 8192,4 9 896,7 4,0 9 900,7 3,0 498,7 (555,9) 685,8 24,6 533,2 70,7 (15.8) (50,3) 6936,9 8 130,9 2.7 8 133,6 18 LIABILITIES Non-current liabilities Interest-bearing debt Put option liability Cash-settled share incentive scheme Operating lease liability Deferred taxation liability Post-retirement defined benefit plan 19 16 20 21 5 17 5 026,3 48,1 8,5 238,2 435,4 217,3 5 973,8 3 709,5 20,3 0,7 223,1 345.2 192.6 4 491,4 Current liabilities Interest-bearing debt Trade and other payables Operating lease liability Taxation payable 19 22 21 3 139,4 3 046,7 10,8 23,7 6 220.6 12 194.4 22 095,1 3 333,0 2 553.0 9,0 13,4 5 908,4 10 399,8 18 533,4 Total liabilities Total equity and liabilities CONSOLIDATED INCOME STATEMENT FOR THE YEARS ENDED 31 MARCH The Foschini Group Limited and its subsidiaries 2016 Rm 2015 Rm Continuing operations Note 26 27 28 29 Revenue Retail turnover Cost of turnover Gross profit Interest income Other income Trading expenses Operating profit before once-off acquisition costs and finance costs Once-off acquisition costs Finance costs Profit before tax Income tax expense Profit from continuing operations Discontinued operations Profit from discontinued operations, net of tax - RCS Group Profit on disposal of discontinued operation - RCS Group Profit for the year 23 746,4 21 107,5 (10 613,1) 10 494,4 1 533,0 1 105,9 (9 5372) 3 596,1 (65,9) (509,0) 3 021,2 (863,9) 2 157,3 18 544,0 16 085,9 (8 484,2) 7 601,7 1 367,7 1 090,4 (7 252,7) 2 807,1 (292,4) (228,1) 2 286.6 (748,8) 1 537.8 30 31 43 43 86,2 273,2 1 897,2 2 157,3 2 155,6 Attributable to: Continuing operations Discontinued operations Equity holders of The Foschini Group Limited Non-controlling interest Profit for the year 2 155,6 1,7 2 157,3 1 537,4 320,6 1 858,0 39,2 1 897,2 32 Earnings per ordinary share (cents) Total Basic Headline Diluted (basic) Diluted (headline) 1 041,5 1024,0 1 031,9 1014,5 909.4 780,3 901,7 773,7 CONSOLIDATED CASH FLOW STATEMENT FOR THE YEARS ENDED 31 MARCH The Foschini Group Limited and its subsidiaries 2016 Rm 2015 Rm Note 36 36 36 Cash flows from operating activities Operating profit before working capital changes Increase in working capital Cash generated from operations Interest Income Finance costs Taxation pald Dividends paid Net cash Inflows (outflows) from operating activities 4 127,2 (1 509,4) 2 617,8 22,3 (509,0) (921,8) (747,8) 461,5 3047,4 (998,4) 2 049,0 30,0 (228,1) (765,7) (1 146,9) (61,7) 37 38 42 Cash flows from Investing activities Purchase of property, plant and equipment and Intangible assets Acquisition of assets through business combinations, net of cash Proceeds from sale of property, plant and equipment Repayment of participation in export partnerships Proceeds from disposal of Investment Proceeds from disposal of discontinued operations Net cash outflows from Investing activities (901,0) (152,4) 14,6 7,2 1,1 (669,8) (2 576,9) 10,2 14.2 (1 030,5) 1 442,7 (1 779,6) Cash flows from financing activities Shares purchased in terms of share Incentive schemes Proceeds from sale of shares in terms of share incentive schemes Increase in interest-bearing debt Net cash Inflows from financing activities Net Increase in cash during the year Cash at the beginning of the year Effect of exchange rate fluctuations on cash held Cash at the end of the year (193,6) 18,1 760,6 585,1 (175,7) 132,6 2 371,6 2 328,5 16,1 800,4 72,3 888,8 487.2 301.3 11,9 800,4 10 NOTES TO THE FINANCIAL STATEMENTS CONTINUED FOR THE YEARS ENDED 31 MARCH The Foschini Group Limited and its subsidiaries 2016 Rm 2015 Rm 27. INTEREST INCOME Trade receivables - retail Sundry 1 510,7 22,3 1 533,0 1 337.7 30,0 1 367,7 28. OTHER INCOME Publishing Income Collection cost recovery Insurance Income Mobile one2one airtime income Sundry Income 399,4 312,4 297,8 81,2 15,1 1 105,9 388,2 304,1 300,3 86,6 11,2 1 090,4 29. TRADING EXPENSES Operating profit before once-off acquisition costs and finance costs has been arrived at after taking account of: Trading expenses Depreciation and amortisation Employee costs Occupancy costs Net bad debt Other operating costs The following disclosable amounts are included above: Auditors remuneration Fees Profit and loss on sale of assets and liabilities Retirement fund expenses (refer to note 33) Staff discount (refer to note 33) (464,7) (3 210,8) (2 043,2) (947,7) (2 870,8) (9 537,2) (428,1) (2 325,2) (1 585,0) (1 023,6) (1 890,8) (7252,7) (5,7) (2,1) (196,5) (32,5) (5,0) (13,2) (173.1) (29,1) 30. FINANCE COSTS Finance costs on financial liabilities measured at amortised cost (509,0) (228,1) CONSOLIDATED STATEMENT OF FINANCIAL POSITION AT 31 MARCH The Foschini Group Limited and its subsidiaries 2016 Rm Restated 2015 Rm Note ASSETS Non-current assets Property, plant and equipment Goodwill and intangible assets Participation in export partnerships Deferred taxation asset 2 335,7 5 577,8 UTAN 8,2 1925.2 4 637,0 8,4 354,7 6 925,3 527,2 8 448,9 Current assets Inventory Trade receivables - retail Other receivables and prepayments Concession receivables Participation in export partnerships Cash 7 8 9 4 10 5 116,1 6 695,0 592,9 347,2 6,2 3 813,9 6 199,9 624,2 156,5 13,2 800,4 11 608,1 18 533,4 888.8 13 646,2 22 095,1 11 Total assets EQUITY AND LIABILITIES Equity attributable to equity holders of The Foschini Group Limited Share capital Share premium Treasury shares Dividend reserve Hedging (deficit) surplus Share-based payments reserve Foreign currency translation reserve Put option reserve Post-retirement defined benefit plan reserve Retained earnings Non-controlling Interest Total equity 12 13 14 3,0 1 078,5 (613,2) 829,1 (26,0) 15 16 17 534,7 (43,0) (58,8) 8192,4 9 896,7 4,0 9 900,7 3,0 498,7 (555,9) 685,8 24,6 533,2 70,7 (15.8) (50,3) 6936,9 8 130,9 2.7 8 133,6 18 LIABILITIES Non-current liabilities Interest-bearing debt Put option liability Cash-settled share incentive scheme Operating lease liability Deferred taxation liability Post-retirement defined benefit plan 19 16 20 21 5 17 5 026,3 48,1 8,5 238,2 435,4 217,3 5 973,8 3 709,5 20,3 0,7 223,1 345.2 192.6 4 491,4 Current liabilities Interest-bearing debt Trade and other payables Operating lease liability Taxation payable 19 22 21 3 139,4 3 046,7 10,8 23,7 6 220.6 12 194.4 22 095,1 3 333,0 2 553.0 9,0 13,4 5 908,4 10 399,8 18 533,4 Total liabilities Total equity and liabilities CONSOLIDATED INCOME STATEMENT FOR THE YEARS ENDED 31 MARCH The Foschini Group Limited and its subsidiaries 2016 Rm 2015 Rm Continuing operations Note 26 27 28 29 Revenue Retail turnover Cost of turnover Gross profit Interest income Other income Trading expenses Operating profit before once-off acquisition costs and finance costs Once-off acquisition costs Finance costs Profit before tax Income tax expense Profit from continuing operations Discontinued operations Profit from discontinued operations, net of tax - RCS Group Profit on disposal of discontinued operation - RCS Group Profit for the year 23 746,4 21 107,5 (10 613,1) 10 494,4 1 533,0 1 105,9 (9 5372) 3 596,1 (65,9) (509,0) 3 021,2 (863,9) 2 157,3 18 544,0 16 085,9 (8 484,2) 7 601,7 1 367,7 1 090,4 (7 252,7) 2 807,1 (292,4) (228,1) 2 286.6 (748,8) 1 537.8 30 31 43 43 86,2 273,2 1 897,2 2 157,3 2 155,6 Attributable to: Continuing operations Discontinued operations Equity holders of The Foschini Group Limited Non-controlling interest Profit for the year 2 155,6 1,7 2 157,3 1 537,4 320,6 1 858,0 39,2 1 897,2 32 Earnings per ordinary share (cents) Total Basic Headline Diluted (basic) Diluted (headline) 1 041,5 1024,0 1 031,9 1014,5 909.4 780,3 901,7 773,7 CONSOLIDATED CASH FLOW STATEMENT FOR THE YEARS ENDED 31 MARCH The Foschini Group Limited and its subsidiaries 2016 Rm 2015 Rm Note 36 36 36 Cash flows from operating activities Operating profit before working capital changes Increase in working capital Cash generated from operations Interest Income Finance costs Taxation pald Dividends paid Net cash Inflows (outflows) from operating activities 4 127,2 (1 509,4) 2 617,8 22,3 (509,0) (921,8) (747,8) 461,5 3047,4 (998,4) 2 049,0 30,0 (228,1) (765,7) (1 146,9) (61,7) 37 38 42 Cash flows from Investing activities Purchase of property, plant and equipment and Intangible assets Acquisition of assets through business combinations, net of cash Proceeds from sale of property, plant and equipment Repayment of participation in export partnerships Proceeds from disposal of Investment Proceeds from disposal of discontinued operations Net cash outflows from Investing activities (901,0) (152,4) 14,6 7,2 1,1 (669,8) (2 576,9) 10,2 14.2 (1 030,5) 1 442,7 (1 779,6) Cash flows from financing activities Shares purchased in terms of share Incentive schemes Proceeds from sale of shares in terms of share incentive schemes Increase in interest-bearing debt Net cash Inflows from financing activities Net Increase in cash during the year Cash at the beginning of the year Effect of exchange rate fluctuations on cash held Cash at the end of the year (193,6) 18,1 760,6 585,1 (175,7) 132,6 2 371,6 2 328,5 16,1 800,4 72,3 888,8 487.2 301.3 11,9 800,4 10 NOTES TO THE FINANCIAL STATEMENTS CONTINUED FOR THE YEARS ENDED 31 MARCH The Foschini Group Limited and its subsidiaries 2016 Rm 2015 Rm 27. INTEREST INCOME Trade receivables - retail Sundry 1 510,7 22,3 1 533,0 1 337.7 30,0 1 367,7 28. OTHER INCOME Publishing Income Collection cost recovery Insurance Income Mobile one2one airtime income Sundry Income 399,4 312,4 297,8 81,2 15,1 1 105,9 388,2 304,1 300,3 86,6 11,2 1 090,4 29. TRADING EXPENSES Operating profit before once-off acquisition costs and finance costs has been arrived at after taking account of: Trading expenses Depreciation and amortisation Employee costs Occupancy costs Net bad debt Other operating costs The following disclosable amounts are included above: Auditors remuneration Fees Profit and loss on sale of assets and liabilities Retirement fund expenses (refer to note 33) Staff discount (refer to note 33) (464,7) (3 210,8) (2 043,2) (947,7) (2 870,8) (9 537,2) (428,1) (2 325,2) (1 585,0) (1 023,6) (1 890,8) (7252,7) (5,7) (2,1) (196,5) (32,5) (5,0) (13,2) (173.1) (29,1) 30. FINANCE COSTS Finance costs on financial liabilities measured at amortised cost (509,0) (228,1)Step by Step Solution
There are 3 Steps involved in it
Step: 1

Get Instant Access to Expert-Tailored Solutions
See step-by-step solutions with expert insights and AI powered tools for academic success
Step: 2

Step: 3
Ace Your Homework with AI
Get the answers you need in no time with our AI-driven, step-by-step assistance
Get Started
Mathematics For Business
Authors: Stanley A Salzman, Charles D Miller, Gary Clendenen
8th Edition
0321357434, 9780321357434