

Question
Complete a table for each curve. The 8 sample times are indicated as t0, t1, t2, t3, t4, t5, t6, and t7. The Sample Levels
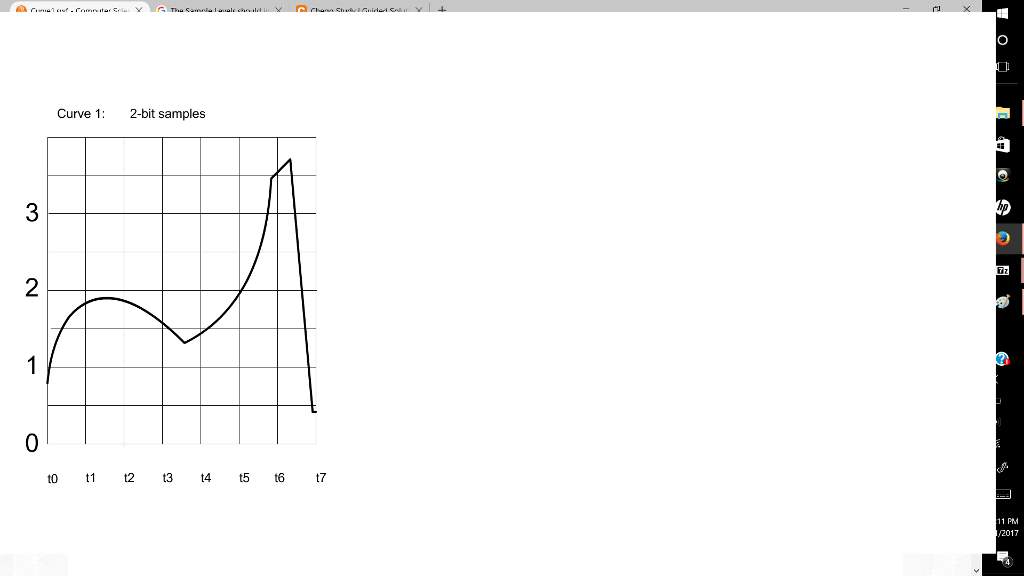
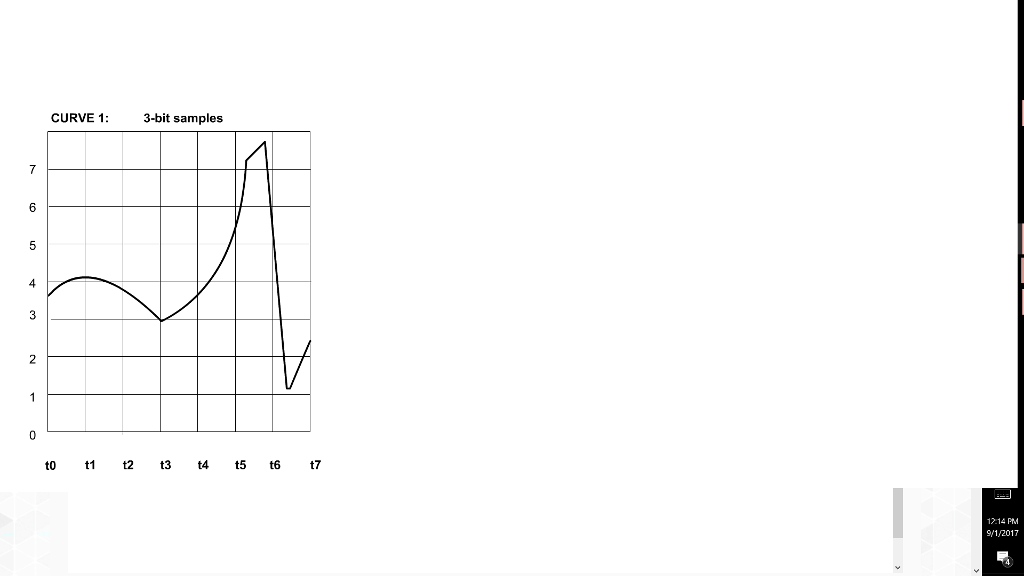
Complete a table for each curve. The 8 sample times are indicated as t0, t1, t2, t3, t4, t5, t6, and t7.
The Sample Levels should include the estimated fractions (to the nearest tenth). The Quantized Levels should only used numbers that appear on the y-axis. The Binary Values are converted binary values of the quantized levels.
If the curve crosses the vertical line above t0 at about 3.2, and you are doing the 2-bit problem, then in the t0 column the Sample Level is 3.2, the Quantized Level is 3, and the Binary Value is 11. Note the leading zeros must be preserved, e.g., 01, 001, etc.
The Final Sequence of Bits should be the binary level for t0, followed by the binary level for t1, etc.
For something like this (this is not my homework sound wave, just looking for examples to compare):
| Sample time | sample level | quantized level | binary |
| t0 | |||
| t1 | |||
| t2 | |||
| t3 | |||
| t4 | |||
| t5 | |||
| t6 | |||
| t7 |
Step by Step Solution
There are 3 Steps involved in it
Step: 1

Get Instant Access to Expert-Tailored Solutions
See step-by-step solutions with expert insights and AI powered tools for academic success
Step: 2

Step: 3
Ace Your Homework with AI
Get the answers you need in no time with our AI-driven, step-by-step assistance
Get Started
Data Access Patterns Database Interactions In Object Oriented Applications
Authors: Clifton Nock
1st Edition
0321555627, 978-0321555625