Answered step by step
Verified Expert Solution
Question
1 Approved Answer
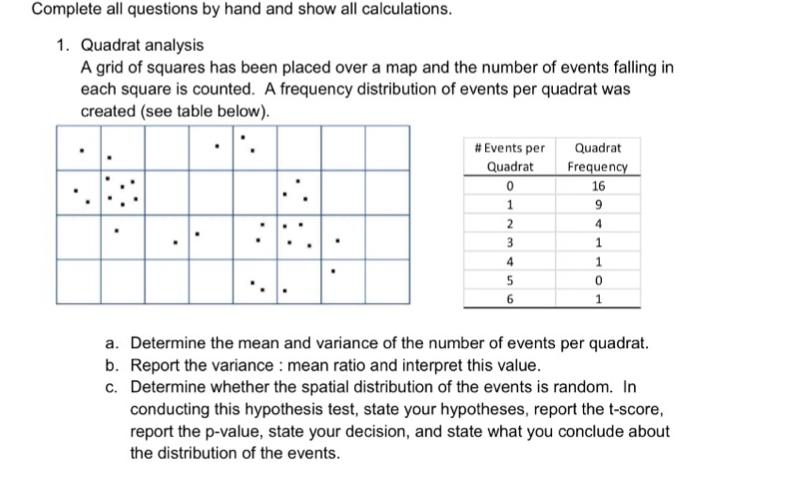
Complete all questions by hand and show all calculations. 1. Quadrat analysis A grid of squares has been placed over a map and the

Complete all questions by hand and show all calculations. 1. Quadrat analysis A grid of squares has been placed over a map and the number of events falling in each square is counted. A frequency distribution of events per quadrat was created (see table below). #Events per Quadrat 0 1 2 3 4 5 6 Quadrat Frequency 16 9 4 1 1 0 1 a. Determine the mean and variance of the number of events per quadrat. b. Report the variance : mean ratio and interpret this value. c. Determine whether the spatial distribution of the events is random. In conducting this hypothesis test, state your hypotheses, report the t-score, report the p-value, state your decision, and state what you conclude about the distribution of the events.
Step by Step Solution
★★★★★
3.39 Rating (158 Votes )
There are 3 Steps involved in it
Step: 1
A 2 Mean 169243141506112 292 Variance 16292292922229224292232922129224292212922529220292262922129221...
Get Instant Access to Expert-Tailored Solutions
See step-by-step solutions with expert insights and AI powered tools for academic success
Step: 2

Step: 3

Ace Your Homework with AI
Get the answers you need in no time with our AI-driven, step-by-step assistance
Get Started


