Question
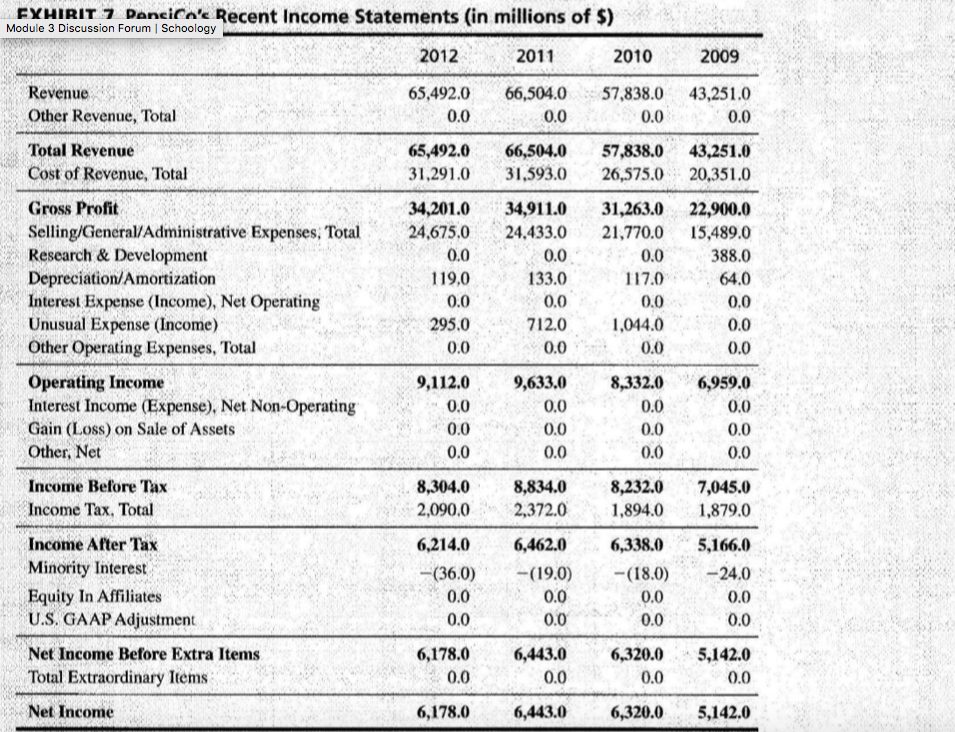
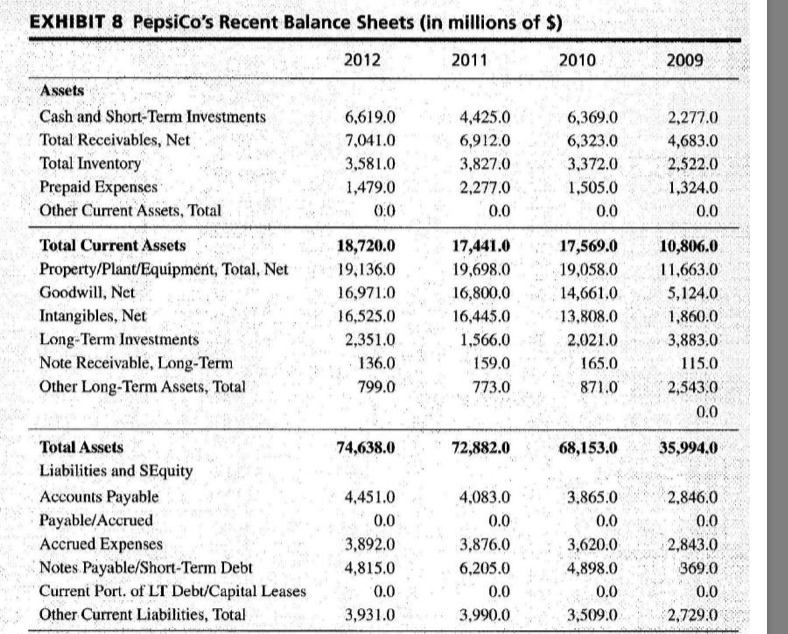
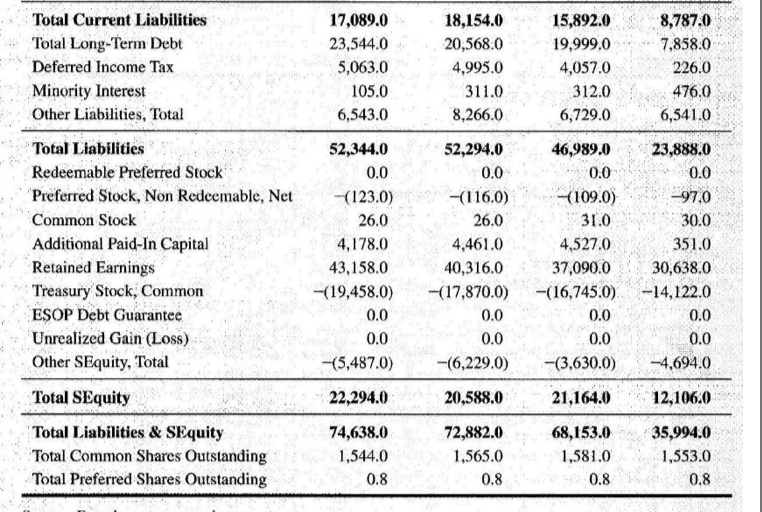
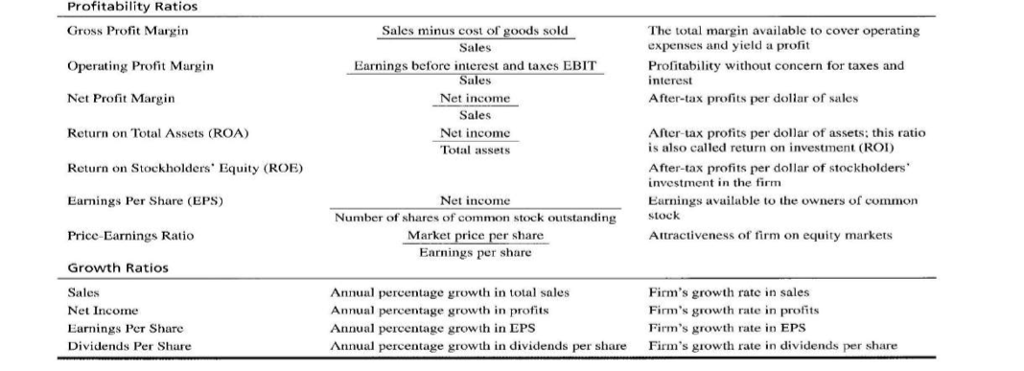
Complete Assurance of Learning Exercise 4C: Financial Ratio Analysis for PepsiCo. Financial Ratios for PepsiCo (2012) use the below information to find Liquidity Ratios: -
Complete Assurance of Learning Exercise 4C: Financial Ratio Analysis for PepsiCo.
Financial Ratios for PepsiCo (2012) use the below information to find
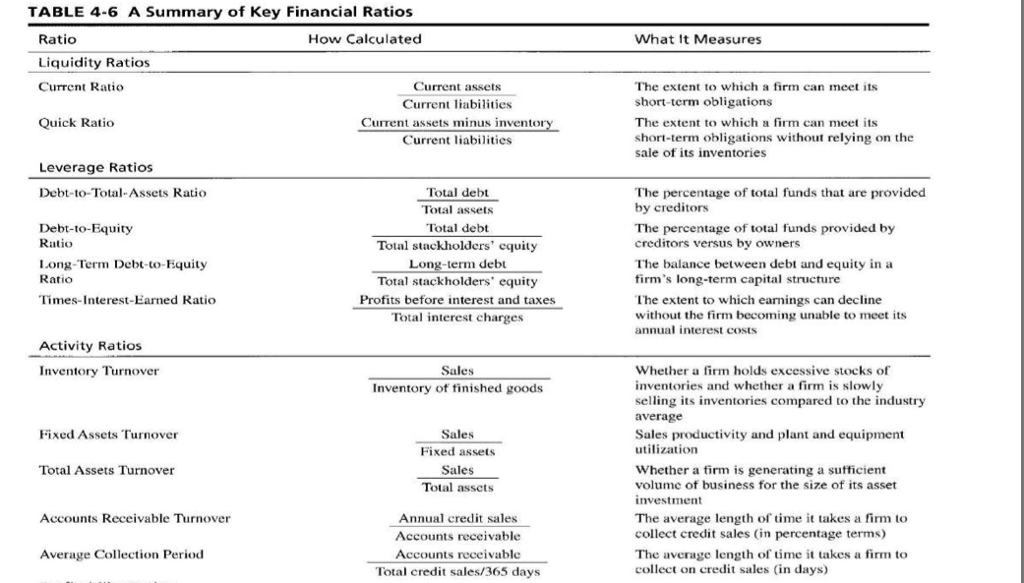
Liquidity Ratios: - Current ratio: - Quick ratio:
Leverage Ratios: - Debt-to-total-assets ratio: - Debt-to-equity ratio: - Long-term debt-to-equity ratio: - Times-earned-interest ratio: Profits before interest and taxes/Total interest charges Activity Ratios: - Inventory turnover: - Fixed assets turnover: - Total assets turnover: - Accounts receivable turnover: Profitability Ratios: - Gross profit margin: - Operating profit margin: - Net profit margin: - Return on total assets (ROA): - Return on stockholders equity (ROE): - Earnings per share (EPS): - Price-earnings ratio:
Growth Ratios: - Sales Annual % growth in total sales - Net income Annual % growth in profits - Earnings per share - Dividends per share
Step by Step Solution
There are 3 Steps involved in it
Step: 1

Get Instant Access to Expert-Tailored Solutions
See step-by-step solutions with expert insights and AI powered tools for academic success
Step: 2

Step: 3

Ace Your Homework with AI
Get the answers you need in no time with our AI-driven, step-by-step assistance
Get Started


