

Question
COMPLETE MASTER BUDGET FOR 2023 Sales Budget Sales Units Price (RM) Sales (RM) Sales 40,000 90 3,600,000 Production Budget Units Costs (RM) Required Units from
COMPLETE MASTER BUDGET FOR 2023
- Sales Budget
| Sales | Units | Price (RM) | Sales (RM) |
| Sales | 40,000 | 90 | 3,600,000 |
| Production Budget | Units | Costs (RM) | |
| Required Units from Sales | 40,000 | ||
| Required Units for Ending | 1,500 | ||
| Beginning Units | 3,125 | 85 | |
| Units to Produce | 38,375 | ||
| Raw Materials Budget | Raw Materials per Unit | Costs per Unit (RM) | |
| Raw Materials | Raw Materials per Unit | 10 | |
| Required Raw Materials | Raw Materials per Unit | 10 | |
| Ending Raw Materials Estimate | Raw Materials per Unit | 10 | |
| Beginning Raw Materials | Raw Materials per Unit | 10 | |
| Raw Materials to Purchase | Raw Materials per Unit | 10 |
2. Direct Labor Budget
| II . Direct Labour Budget | ||||
| Direct Labour (DL) Budget | DL Hour per Unit | DL Rate (RM) | DL Hours Required | DL Cost (RM) |
| Direct Labour | 4 | 7 | 153,500 | 1,074,500 |
| Overhead Budget | ||||
| Variable Overhead | Pre-determined Rate | DL Hours Required | Variable Overhead Costs (RM) | |
| Variable Overhead | 1.5 | 153,500 | 230,250 | |
| Fixed Overhead | RM | |||
| Factory Rent | 120,000 | |||
| Depreciation for Machines | 30,000 | |||
| Factory Maintenance and Cleaning | 60,000 | |||
| Total Fixed Overhead | 210,000 | |||
| Total Overhead | 440,250 |
3. Selling and Administration Budget
| Selling and Admin | (RM) |
| Advertising | 150,000 |
| Salaries | 360,000 |
| Office Expenses | 30,000 |
| Depreciation of Office Equipment | 40,000 |
| Rent of the Admin Building | 60,000 |
| Total Selling and Admin | 640,000 |
4. Manufacturing Cost
| Direct Materials | RM |
| Beginning Raw Materials Inventory | 40,000 |
| Add: Purchase of Raw Materials | 112,125 |
| Raw Materials Available for Use | 152,125 |
| Deduct: Ending Raw Materials Inventory | 50,000 |
| Raw Materials Used in Production | 102,125 |
| Direct Labour | 1,074,500 |
| Manufacturing Overhead | |
| Variable Overhead | 230,250 |
| Fixed Overhead | 210,000 |
| Total Manufacturing Overhead Costs | 440,250 |
| Total Manufacturing Costs | 1,616,875 |
| Total Unit Produced | 38,375 |
| Product Costs | 42.13 |
| Ending Finished Goods | 210,668 |
5. Cost of Good Sold
| Costs of Goods Sold | |
| Beginning Finished Goods Inventory | 200,000 |
| Add: Costs of Goods Manufactured | 1,616,875 |
| Goods Available for Sale | 1,816,875 |
| Deduct: Ending Finished Goods Inventory | 210,668 |
| Costs of Goods Sold | 1,606,207 |
6. Quarterly Budget Report
| Period | Quarter 1 | Quarter 2 | Quarter 3 | Quarter 4 | Annual |
| Percentage from Annual | 10% | 30% | 40% | 20% | 100% |
| Sales Units | 4,000 | 12,000 | 16,000 | 8,000 | 40,000 |
| Sales (RM) | 360,000 | 1,080,000 | 1,440,000 | 720,000 | 3,600,000 |
| Production Budget | Quarter 1 | Quarter 2 | Quarter 3 | Quarter 4 | Annual |
| Required Units from Sales | 4,000 | 12,000 | 16,000 | 8,000 | 40,000 |
| Required Units from Ending | 1,500 | 1,500 | 1,500 | 1,500 | 1,500 |
| Beginning Units | 2,353 | 1,500 | 1,500 | 1,500 | 2,353 |
| Units to Produce | 3,147 | 12,000 | 16,000 | 8,000 | 39,147 |
| Raw Materials Budget | Quarter 1 | Quarter 2 | Quarter 3 | Quarter 4 | Annual |
| Required Raw Materials | 9,441 | 36,000 | 48,000 | 24,000 | 117,441 |
| Ending Raw Materials Estimate | 1,250 | 1,250 | 1,250 | 1,250 | 5,000 |
| Beginning Raw Materials | 8,000 | 1,250 | 1,250 | 1,250 | 8,000 |
| Raw Materials to Purchase | 2,691 | 36,000 | 48,000 | 24,000 | 110,691 |
| Raw Materials Costs (RM) | 26,910 | 360,000 | 480,000 | 240,000 | 1,106,910 |
| Direct Labour Budget | Quarter 1 | Quarter 2 | Quarter 3 | Quarter 4 | Annual |
| Direct Labour Hours Required | 12,588 | 48,000 | 64,000 | 32,000 | 156,588 |
| Direct Labour Costs (RM) | 88,116 | 336,000 | 448,000 | 224,000 | 1,096,116 |
| Variable Overhead | Quarter 1 | Quarter 2 | Quarter 3 | Quarter 4 | Annual |
| Variable Overhead Allocation | 12,588 | 48,000 | 64,000 | 32,000 | 156,588 |
| Variable Overhead Costs (RM) | 18,882 | 72,000 | 96,000 | 48,000 | 234,882 |
| Fixed Overhead | Quarter 1 | Quarter 2 | Quarter 3 | Quarter 4 | Annual |
| Factory Rent | 30,000 | 30,000 | 30,000 | 30,000 | 120,000 |
| Depreciation for Machines | 7,500 | 7,500 | 7,500 | 7,500 | 30,000 |
| Factory Maintenance and Cleaning | 15,000 | 15,000 | 15,000 | 15,000 | 60,000 |
| Total Fixed Overhead | 52,500 | 52,500 | 52,500 | 52,500 | 210,000 |
| Selling and Admin | Quarter 1 | Quarter 2 | Quarter 3 | Quarter 4 | Annual |
| Advertising | 37,500 | 37,500 | 37,500 | 37,500 | 150,000 |
| Salaries | 90,000 | 90,000 | 90,000 | 90,000 | 360,000 |
| Office Expenses | 7,500 | 7,500 | 7,500 | 7,500 | 30,000 |
| Depreciation of Office Equipment | 10,000 | 10,000 | 10,000 | 10,000 | 40,000 |
| Rent of the Admin Building | 15,000 | 15,000 | 15,000 | 15,000 | 60,000 |
| Total Selling and Admin | 160,000 | 160,000 | 160,000 | 160,000 | 640,000 |
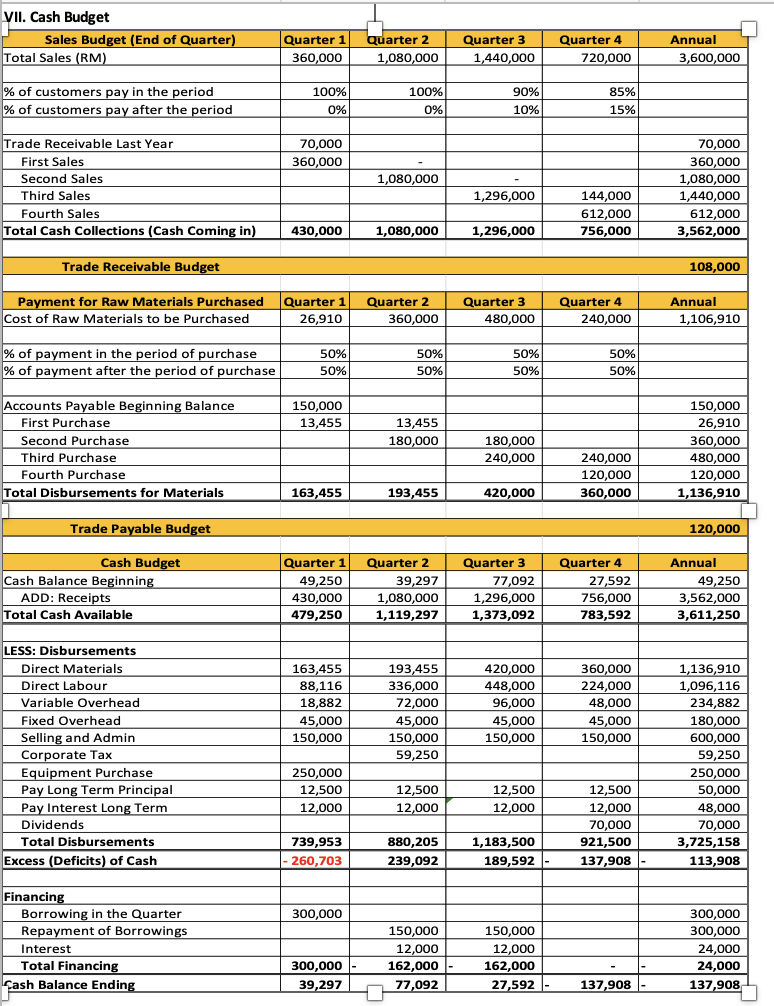
7.Cash Budget
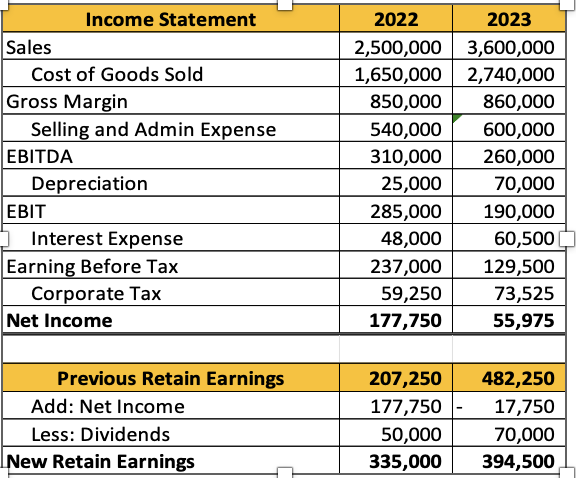
8. Income Statement
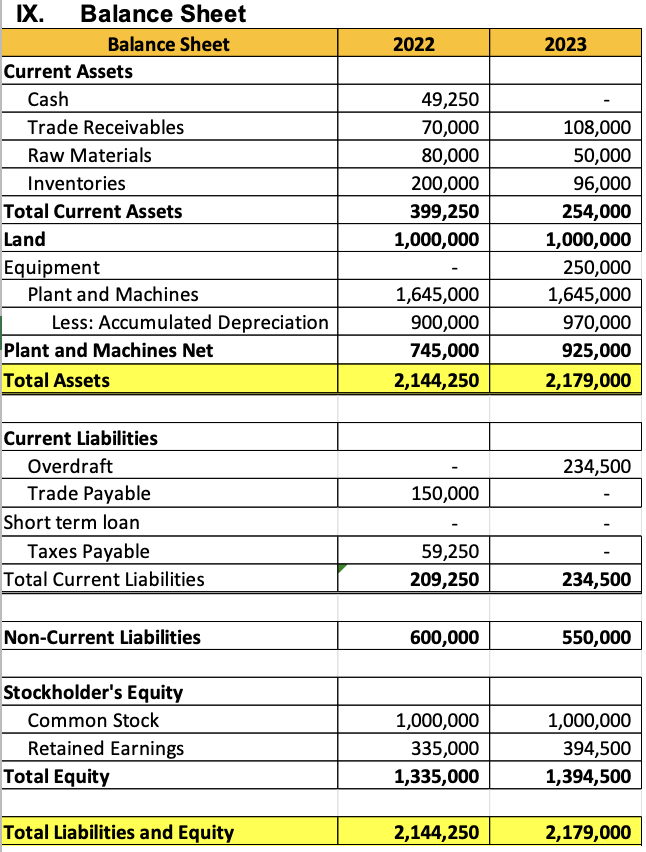
9. Balance sheet
C. Prepare a performance analysis on the budget which includes financial ratio analysis, economic value-added analysis, and market value analysis, between 2022 and the budget
\begin{tabular}{|l|r|r|} \hline \multicolumn{1}{|c|}{ Income Statement } & \multicolumn{1}{c|}{2022} & \multicolumn{1}{c|}{2023} \\ \hline Sales & 2,500,000 & 3,600,000 \\ \hline Cost of Goods Sold & 1,650,000 & 2,740,000 \\ \hline Gross Margin & 850,000 & 860,000 \\ \hline Selling and Admin Expense & 540,000 & 600,000 \\ \hline EBITDA & 310,000 & 260,000 \\ \hline Depreciation & 25,000 & 70,000 \\ \hline EBIT & 285,000 & 190,000 \\ \hline Interest Expense & 48,000 & 60,500 \\ \hline Earning Before Tax & 237,000 & 129,500 \\ \hline Corporate Tax & 59,250 & 73,525 \\ \hline Net Income & 177,750 & 55,975 \\ \hline \hline & & \\ \hline Previous Retain Earnings & 207,250 & 482,250 \\ \hline Add: Net Income & 177,750 & 17,750 \\ \hline Less: Dividends & 335,000 & 70,000 \\ \hline New Retain Earnings & 394,500 \\ \hline \end{tabular} IX. Balance Sheet \begin{tabular}{|c|c|c|} \hline Balance Sheet & 2022 & 2023 \\ \hline \multicolumn{3}{|l|}{ Current Assets } \\ \hline Cash & 49,250 & - \\ \hline Trade Receivables & 70,000 & 108,000 \\ \hline Raw Materials & 80,000 & 50,000 \\ \hline Inventories & 200,000 & 96,000 \\ \hline Total Current Assets & 399,250 & 254,000 \\ \hline Land & 1,000,000 & 1,000,000 \\ \hline Equipment & - & 250,000 \\ \hline Plant and Machines & 1,645,000 & 1,645,000 \\ \hline Less: Accumulated Depreciation & 900,000 & 970,000 \\ \hline Plant and Machines Net & 745,000 & 925,000 \\ \hline Total Assets & 2,144,250 & 2,179,000 \\ \hline \multicolumn{3}{|l|}{ Current Liabilities } \\ \hline Overdraft & - & 234,500 \\ \hline Trade Payable & 150,000 & - \\ \hline Short term loan & - & - \\ \hline Taxes Payable & 59,250 & - \\ \hline Total Current Liabilities & 209,250 & 234,500 \\ \hline Non-Current Liabilities & 600,000 & 550,000 \\ \hline \multicolumn{3}{|l|}{ Stockholder's Equity } \\ \hline Common Stock & 1,000,000 & 1,000,000 \\ \hline Retained Earnings & 335,000 & 394,500 \\ \hline Total Equity & 1,335,000 & 1,394,500 \\ \hline Total Liabilities and Equity & 2,144,250 & 2,179,000 \\ \hline \end{tabular} VII. Cash Budget \begin{tabular}{|c|c|c|c|c|c|} \hline Sales Budget (End of Quarter) & Quarter 1 & Quarter 2 & Quarter 3 & Quarter 4 & Annual \\ \hline Total Sales (RM) & 360,000 & 1,080,000 & 1,440,000 & 720,000 & 3,600,000 \\ \hline% of customers pay in the period & 100% & 100% & 90% & 85% & \\ \hline% of customers pay after the period & 0% & 0% & 10% & 15% & \\ \hline Trade Receivable Last Year & 70,000 & & & & 70,000 \\ \hline First Sales & 360,000 & - & & & 360,000 \\ \hline Second Sales & & 1,080,000 & - & & 1,080,000 \\ \hline Third Sales & & & 1,296,000 & 144,000 & 1,440,000 \\ \hline Fourth Sales & & & & 612,000 & 612,000 \\ \hline Total Cash Collections (Cash Coming in) & 430,000 & 1,080,000 & 1,296,000 & 756,000 & 3,562,000 \\ \hline \multicolumn{5}{|l|}{ Trade Receivable Budget } & 108,000 \\ \hline Payment for Raw Materials Purchased & Quarter 1 & Quarter 2 & Quarter 3 & Quarter 4 & Annual \\ \hline Cost of Raw Materials to be Purchased & 26,910 & 360,000 & 480,000 & 240,000 & 1,106,910 \\ \hline% of payment in the period of purchase & 50% & 50% & 50% & 50% & \\ \hline% of payment after the period of purchase & 50% & 50% & 50% & 50% & \\ \hline Accounts Payable Beginning Balance & 150,000 & & & & 150,000 \\ \hline First Purchase & 13,455 & 13,455 & & & 26,910 \\ \hline Second Purchase & & 180,000 & 180,000 & & 360,000 \\ \hline Third Purchase & & & 240,000 & 240,000 & 480,000 \\ \hline Fourth Purchase & & & & 120,000 & 120,000 \\ \hline Total Disbursements for Materials & 163,455 & 193,455 & 420,000 & 360,000 & 1,136,910 \\ \hline \end{tabular} Trade Payable Budget 120,000 \begin{tabular}{|c|c|c|c|c|c|} \hline Cash Budget & Quarter 1 & Quarter 2 & Quarter 3 & Quarter 4 & Annual \\ \hline Cash Balance Beginning & 49,250 & 39,297 & 77,092 & 27,592 & 49,250 \\ \hline ADD: Receipts & 430,000 & 1,080,000 & 1,296,000 & 756,000 & 3,562,000 \\ \hline Total Cash Available & 479,250 & 1,119,297 & 1,373,092 & 783,592 & 3,611,250 \\ \hline \multicolumn{6}{|l|}{ LESS: Disbursements } \\ \hline Direct Materials & 163,455 & 193,455 & 420,000 & 360,000 & 1,136,910 \\ \hline Direct Labour & 88,116 & 336,000 & 448,000 & 224,000 & 1,096,116 \\ \hline Variable Overhead & 18,882 & 72,000 & 96,000 & 48,000 & 234,882 \\ \hline Fixed Overhead & 45,000 & 45,000 & 45,000 & 45,000 & 180,000 \\ \hline Selling and Admin & 150,000 & 150,000 & 150,000 & 150,000 & 600,000 \\ \hline Corporate Tax & & 59,250 & & & 59,250 \\ \hline Equipment Purchase & 250,000 & & & & 250,000 \\ \hline Pay Long Term Principal & 12,500 & 12,500 & 12,500 & 12,500 & 50,000 \\ \hline Pay Interest Long Term & 12,000 & 12,000 & 12,000 & 12,000 & 48,000 \\ \hline Dividends & & & & 70,000 & 70,000 \\ \hline Total Disbursements & 739,953 & 880,205 & 1,183,500 & 921,500 & 3,725,158 \\ \hline Excess (Deficits) of Cash & 260,703 & 239,092 & 189,592 & 137,908 & 113,908 \\ \hline \multicolumn{6}{|l|}{ Financing } \\ \hline Borrowing in the Quarter & 300,000 & & & & 300,000 \\ \hline Repayment of Borrowings & & 150,000 & 150,000 & & 300,000 \\ \hline Interest & & 12,000 & 12,000 & & 24,000 \\ \hline Total Financing & 300,000 & 162,000 & 162,000 & - & 24,000 \\ \hline Sash Balance Ending & 39,297 & 77,092 & 27,592 & 137,908 & 137,908 \\ \hline \end{tabular}Step by Step Solution
There are 3 Steps involved in it
Step: 1

Get Instant Access to Expert-Tailored Solutions
See step-by-step solutions with expert insights and AI powered tools for academic success
Step: 2

Step: 3
Ace Your Homework with AI
Get the answers you need in no time with our AI-driven, step-by-step assistance
Get Started
Uniform Administrative Requirements Cost Principles And Audit Requirements For Federal Awards A Handbook For Institutions Of Higher Education And State And Local Governments
Authors: Andrew Shepard-Smith
1st Edition
1505298482, 978-1505298482