Answered step by step
Verified Expert Solution
Question
1 Approved Answer
Complete parts a through d below using the partially completed one-way ANOVA table shown. Source of Variation SS df MS F-ratio Between groups 3 Within
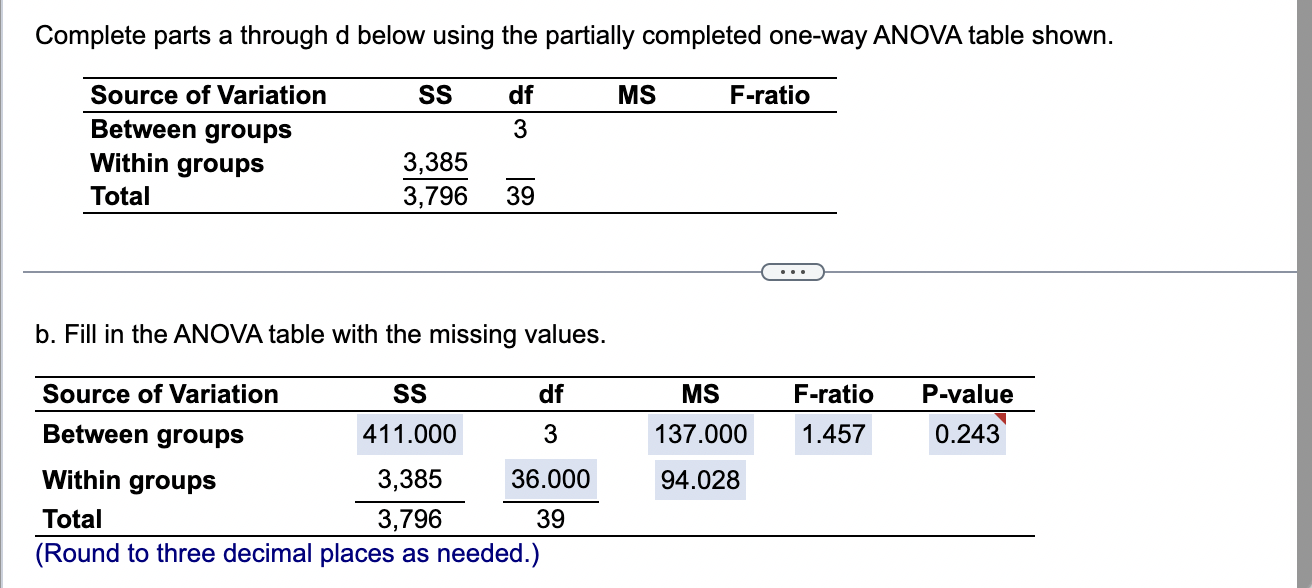
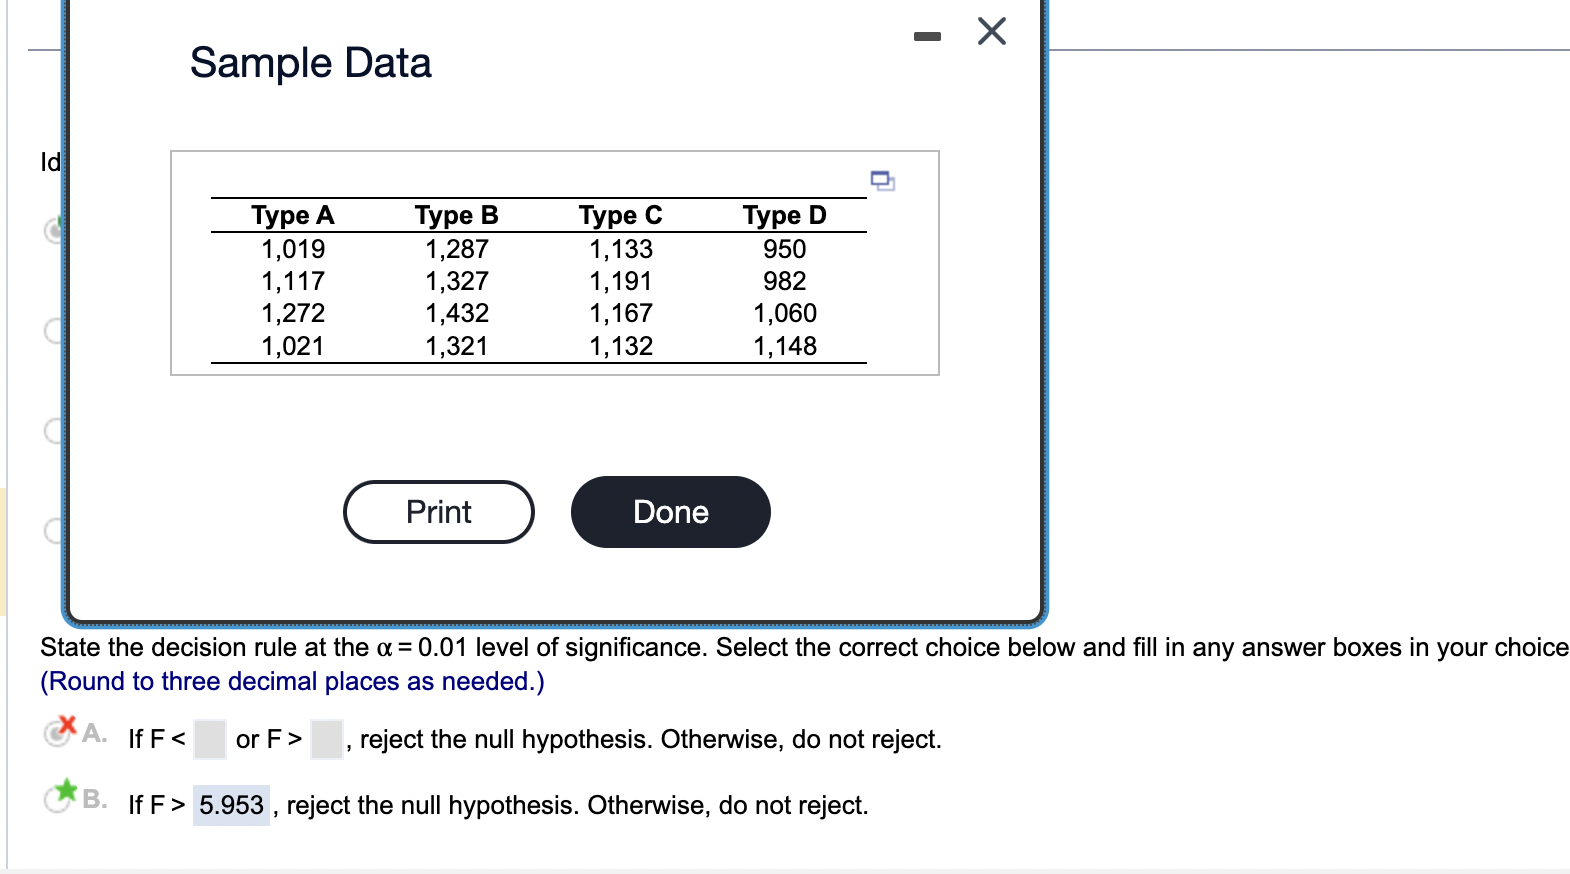
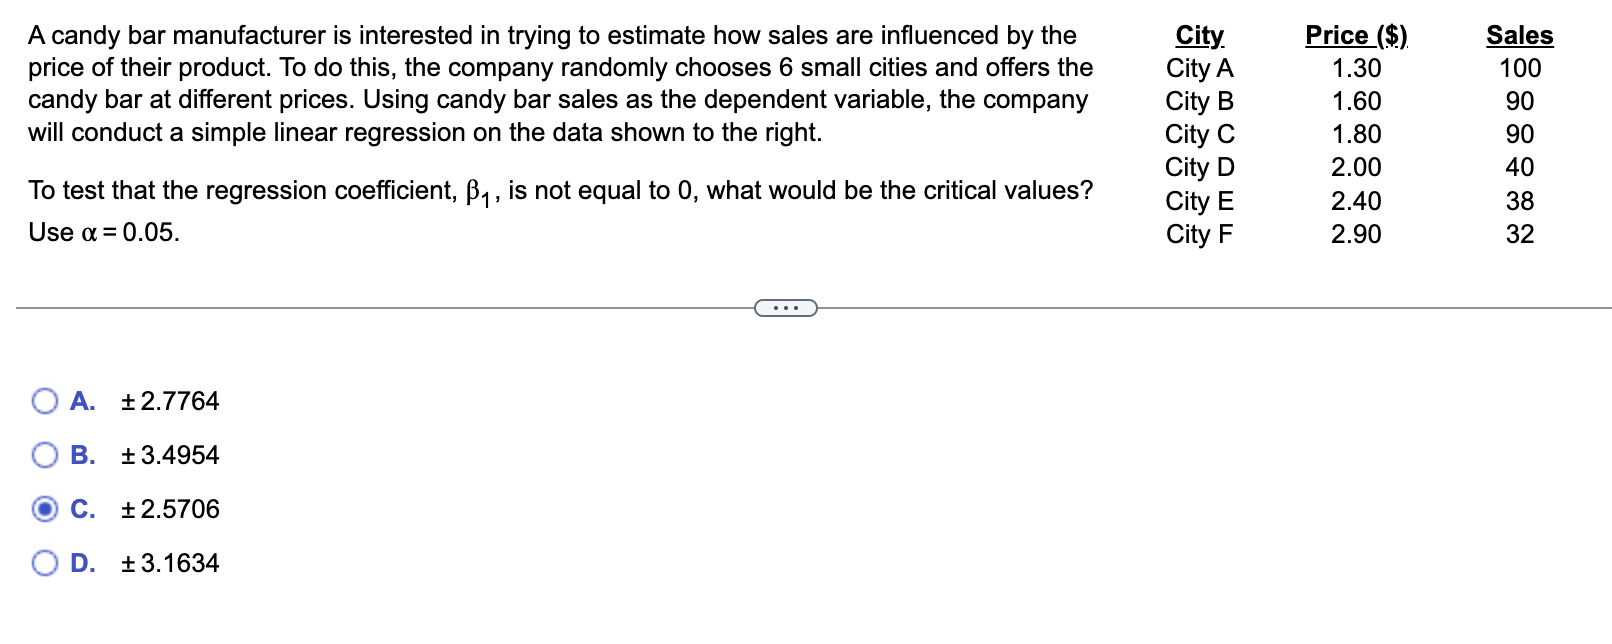
Complete parts a through d below using the partially completed one-way ANOVA table shown. Source of Variation SS df MS F-ratio Between groups 3 Within groups 3,385 Total 3,796 39 . . . b. Fill in the ANOVA table with the missing values. Source of Variation SS df MS F-ratio P-value Between groups 411.000 3 137.000 1.457 0.243 Within groups 3,385 36.000 94.028 Total 3,796 39 (Round to three decimal places as needed.)A candy bar manufacturer is interested in trying to estimate how sales are inuenced by the price of their product. To do this, the company randomly chooses 6 small cities and offers the candy bar at different prices. Using candy bar sales as the dependent variable, the company will conduct a simple linear regression on the data shown to the right. To test that the regression coefficient, [31 , is not equal to 0, what would be the critical values? Use (it = 0.05. $5965.11 $2.7764 1 3.4954 25706 1 3.1634 Qty. City A City B City C City D City E City F Sample Data Id :1 Type A Type 3 Type C Type D 1,019 1,287 1,133 950 1,117 1,327 1,191 982 1,272 1,432 1,167 1,060 1,021 1,321 1,132 1,148 -@ State the decision rule at the or = 0.01 level of significance. Select the correct choice below and ll in any answer boxes in your choice (Round to three decimal places as needed.) x If F , reject the null hypothesis. Otherwise, do not reject. If F > 5.953 , reject the null hypothesis. Othenivise, do not reject
Step by Step Solution
There are 3 Steps involved in it
Step: 1
Get Instant Access to Expert-Tailored Solutions
See step-by-step solutions with expert insights and AI powered tools for academic success
Step: 2
Step: 3
Ace Your Homework with AI
Get the answers you need in no time with our AI-driven, step-by-step assistance
Get Started