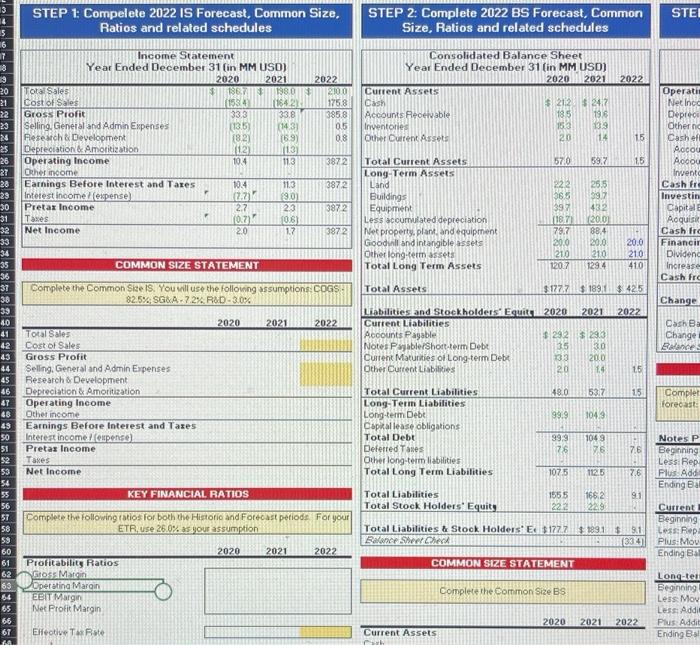
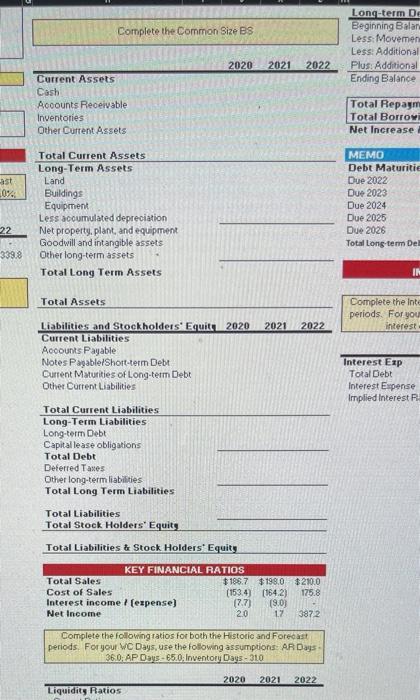
Question: complete step 2 STEI 14 STEP 1: Compelete 2022 IS Forecast, Common Size, Ratios and related schedules STEP 2: Complete 2022 BS Forecast, Common Size,


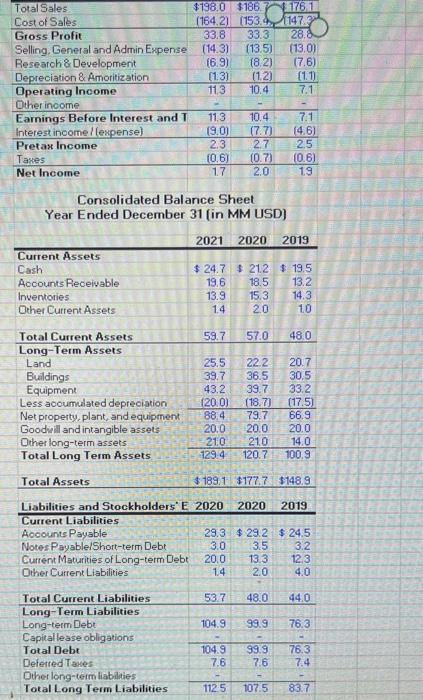
STEI 14 STEP 1: Compelete 2022 IS Forecast, Common Size, Ratios and related schedules STEP 2: Complete 2022 BS Forecast, Common Size, Ratios and related schedules 6 17 2022 2022 2100 1758 385.8 05 08 Consolidated Balance Sheet Year Ended December 31 (in MM USD) 2020 2021 Current Assets Cash $212 $24.7 Accounts Receivable 13.5 196 Inventories 183 139 Other Current Assets 20 14 15 3 20 21 22 23 24 25 26 27 28 23 30 31 Income Statement Year Ended December 31 (in MM USD) 2020 2021 Total Sales $ 1367 1380 Cost of Sales 1534 (1842 Gross Profit 33.3 33.8 Selling. General and Admin Expenses 113.5 (143) Research & Development 1821 169) Depreciation & Amortization (112) 113 Operating Income 104 113 Other income Earnings Before Interest and Tares 10:4 113 Interest income expense) 19.01 Pretax Income 2.2 23 Taxes 10.7 106) Net Income 20 17 3872 57.0 59.7 15 3872 1:21 3872 Operati Net Ince Deprec Other Cash of Accou Accou Invento Cash for Investin Capital Aoquis Cashiro Financir Dividend Increase Cash Fr Total Current Assets Long-Term Assets Land Buildings Equipment Less accumulated depreciation property, plant, and equipment Goodall and intangible assets Other long-term assets Total Long Term Assets 222 365 397 (187) 78.7 20.0 F 25.5 397 432 2010 88.4 20.0 210 1294 3872 210 20.0 210 410 33 34 35 36 37 38 COMMON SIZE STATEMENT 120.7 Total Assets $127.71 $ 1891 $.425 Complete the Common Sie Is. You will use the following assumptions: COGS 82.5% SG.A.7.2% ROD-3.0% Change 2022 2020 2021 2022 Cash Be Change 40 41 42 43 44 45 46 47 48 Liabilities and Stockholders' Equit 2020 2021 Current Liabilities Accounts Payable $ 292$ 233 Notes Payable/Short-term Debt 35 30 Current Matunities of Long term Debt 133 200 Other Current Liabilities 20 1.4 15 Total Sales Cost of Sales Gross Profit Selling. General and Admin Expenses Research & Development Depreciation & Amortization Operating Income Other income Earnings Before Interest and Taxes Interest income opense) Pretax Income Taxes Net Income Complet forecast 50 51 S2 53 54 55 56 57 Total Current Liabilities 490 63.7 15 Long-Term Liabilities Long-term Debt 99.9 304,9 Capital lease obligations Debt 999 1049 Deferred Tales 76 76 7.6 Other long-term liabilities Total Long Term Liabilities 1075 112.5 7.6 Total Liabilities 1555 1662 9.1 Total Stock Holders' Equity 222 22.9 Total Liabilities & Stock Holders E$122.7.1991 8.1 Balance SheCheck 1334 Notes P Beginning Less Rep Plus Add Ending Ba KEY FINANCIAL RATIOS Complete the following ratios for both the Historie and Forecast potlode For your ETR,use 26.0% as your assumption Current Beginning Less Rep Plus:Mou Ending B 2020 2021 2022 COMMON SIZE STATEMENT 39&&82288 62 65 Profitability Ratios BOSS Matin Operatina Marin EBIT Margin Net Profit Margin Complete the Common Size BS 65 Long-tel Beginning Less Mox Less Addi Plus Addit Ending B 2020 2021 2022 Effective Tax Rate Current Assets Complete the Common Size BS Long-term De Beginning Balan Less: Movemen Less: Additional Plus. Additional Ending Balance 2020 2021 2022 Current Assets Cash Accounts Receivable Inventories Other Current Assets Total Repaym Total Borrow Net Increase -0% Total Current Assets Long-Term Assets Land Buildings Equipment Less accumulated depreciation Net property, plant, and equipment Goodwill and intangible assets Other long-term assets Total Long Term Assets MEMO Debt Maturitie Due 2022 Due 2023 Due 2024 Due 2025 Due 2026 Total Long-term Del 22 339.8 Total Assets Complete the inte periods. For you interest 2021 2022 Liabilities and Stockholders' Equity 2020 Current Liabilities Accounts Payable Notes Payable/Short-term Debt Current Maturities of long-term Debt Other Current Liabilities Interest Exp Total Debt Interest Expense Implied Interest Total Current Liabilities Long-Term Liabilities Long-term Debt Capital lease obligations Total Debt Deferred Tanes Other long-term liabilities Total Long Term Liabilities Total Liabilities Total Stock Holders' Equit Total Liabilities & Stock Holders' Equity KEY FINANCIAL RATIOS Total Sales $189.7 $198.0 $210.0 Cost of Sales (1534) (1642) 175.8 Interest income / (expense) (7.7) 19.03 Net Income 20 12 3872 Complete the following ratios for both the Historic and Forecast periods. For your WC Days, use the following assumptions AR Days 36.0: AP Days - 65.0: Inventory Days-310 2020 2021 2022 Liquidity Ratios Total Sales $1980 $186 176 1 Cost of Sales (164.2) (153., 147 Gross Profit 33.8 33.3 28.2 Selling, General and Admin Expense (14.3) (13.5) (13.0) Research & Development 16.9) 18.2) 17.6) Depreciation & Amortization (1:31 (12) (1.1) Operating Income 113 10.4 7.1 Other income Earnings Before Interest and T 11.3 10.4 7.1 Interest incomellexpense) (9.0) (7.7) (4.6) Pretax Income 2.3 27 2.5 Taxes (0.6) (0.7) (0.6) Net Income 17 2.0 19 Consolidated Balance Sheet Year Ended December 31 (in MM USD) - NO 2021 2020 2019 $24.7 $ 212 $19.5 19.6 18.5 13.2 13.9 15.3 14.3 14 20 10 59.7 57.0 48.0 Current Assets Cash Accounts Receivable Inventories Other Current Assets Total Current Assets Long-Term Assets Land Buildings Equipment Less acoumulated depreciation Net property, plant, and equipment Goodwill and intangible assets Other long-term assets Total Long Term Assets 25.5 39.7 43.2 120.0) 88.4 20.0 210 1294 22.2 36.5 39.7 (18.7) 79.7 200 210 120.7 20.7 30.5 33.2 (17.5) 66.9 20.0 14.0 100.9 Total Assets $189.1 $177.7 $148.9 Liabilities and Stockholders' E 2020 2020 2019 Current Liabilities Accounts Payable 29.3 $29.2 $24.5 Notes Payable/Short-term Debt 3.0 3.5 3.2 Current Maturities of Long-term Debt 20.0 13.3 12.3 Other Current Liabilities 14 20 4.0 53.7 48.0 44.0 104.9 99.9 76.3 Total Current Liabilities Long-Term Liabilities Long-term Debt Capital lease obligations Total Debt Deferred Taxes Other long-term liabilities Total Long Term Liabilities os 104.9 7.6 99.9 7.6 76.3 7.4 1125 107.5 83.7 STEI 14 STEP 1: Compelete 2022 IS Forecast, Common Size, Ratios and related schedules STEP 2: Complete 2022 BS Forecast, Common Size, Ratios and related schedules 6 17 2022 2022 2100 1758 385.8 05 08 Consolidated Balance Sheet Year Ended December 31 (in MM USD) 2020 2021 Current Assets Cash $212 $24.7 Accounts Receivable 13.5 196 Inventories 183 139 Other Current Assets 20 14 15 3 20 21 22 23 24 25 26 27 28 23 30 31 Income Statement Year Ended December 31 (in MM USD) 2020 2021 Total Sales $ 1367 1380 Cost of Sales 1534 (1842 Gross Profit 33.3 33.8 Selling. General and Admin Expenses 113.5 (143) Research & Development 1821 169) Depreciation & Amortization (112) 113 Operating Income 104 113 Other income Earnings Before Interest and Tares 10:4 113 Interest income expense) 19.01 Pretax Income 2.2 23 Taxes 10.7 106) Net Income 20 17 3872 57.0 59.7 15 3872 1:21 3872 Operati Net Ince Deprec Other Cash of Accou Accou Invento Cash for Investin Capital Aoquis Cashiro Financir Dividend Increase Cash Fr Total Current Assets Long-Term Assets Land Buildings Equipment Less accumulated depreciation property, plant, and equipment Goodall and intangible assets Other long-term assets Total Long Term Assets 222 365 397 (187) 78.7 20.0 F 25.5 397 432 2010 88.4 20.0 210 1294 3872 210 20.0 210 410 33 34 35 36 37 38 COMMON SIZE STATEMENT 120.7 Total Assets $127.71 $ 1891 $.425 Complete the Common Sie Is. You will use the following assumptions: COGS 82.5% SG.A.7.2% ROD-3.0% Change 2022 2020 2021 2022 Cash Be Change 40 41 42 43 44 45 46 47 48 Liabilities and Stockholders' Equit 2020 2021 Current Liabilities Accounts Payable $ 292$ 233 Notes Payable/Short-term Debt 35 30 Current Matunities of Long term Debt 133 200 Other Current Liabilities 20 1.4 15 Total Sales Cost of Sales Gross Profit Selling. General and Admin Expenses Research & Development Depreciation & Amortization Operating Income Other income Earnings Before Interest and Taxes Interest income opense) Pretax Income Taxes Net Income Complet forecast 50 51 S2 53 54 55 56 57 Total Current Liabilities 490 63.7 15 Long-Term Liabilities Long-term Debt 99.9 304,9 Capital lease obligations Debt 999 1049 Deferred Tales 76 76 7.6 Other long-term liabilities Total Long Term Liabilities 1075 112.5 7.6 Total Liabilities 1555 1662 9.1 Total Stock Holders' Equity 222 22.9 Total Liabilities & Stock Holders E$122.7.1991 8.1 Balance SheCheck 1334 Notes P Beginning Less Rep Plus Add Ending Ba KEY FINANCIAL RATIOS Complete the following ratios for both the Historie and Forecast potlode For your ETR,use 26.0% as your assumption Current Beginning Less Rep Plus:Mou Ending B 2020 2021 2022 COMMON SIZE STATEMENT 39&&82288 62 65 Profitability Ratios BOSS Matin Operatina Marin EBIT Margin Net Profit Margin Complete the Common Size BS 65 Long-tel Beginning Less Mox Less Addi Plus Addit Ending B 2020 2021 2022 Effective Tax Rate Current Assets Complete the Common Size BS Long-term De Beginning Balan Less: Movemen Less: Additional Plus. Additional Ending Balance 2020 2021 2022 Current Assets Cash Accounts Receivable Inventories Other Current Assets Total Repaym Total Borrow Net Increase -0% Total Current Assets Long-Term Assets Land Buildings Equipment Less accumulated depreciation Net property, plant, and equipment Goodwill and intangible assets Other long-term assets Total Long Term Assets MEMO Debt Maturitie Due 2022 Due 2023 Due 2024 Due 2025 Due 2026 Total Long-term Del 22 339.8 Total Assets Complete the inte periods. For you interest 2021 2022 Liabilities and Stockholders' Equity 2020 Current Liabilities Accounts Payable Notes Payable/Short-term Debt Current Maturities of long-term Debt Other Current Liabilities Interest Exp Total Debt Interest Expense Implied Interest Total Current Liabilities Long-Term Liabilities Long-term Debt Capital lease obligations Total Debt Deferred Tanes Other long-term liabilities Total Long Term Liabilities Total Liabilities Total Stock Holders' Equit Total Liabilities & Stock Holders' Equity KEY FINANCIAL RATIOS Total Sales $189.7 $198.0 $210.0 Cost of Sales (1534) (1642) 175.8 Interest income / (expense) (7.7) 19.03 Net Income 20 12 3872 Complete the following ratios for both the Historic and Forecast periods. For your WC Days, use the following assumptions AR Days 36.0: AP Days - 65.0: Inventory Days-310 2020 2021 2022 Liquidity Ratios Total Sales $1980 $186 176 1 Cost of Sales (164.2) (153., 147 Gross Profit 33.8 33.3 28.2 Selling, General and Admin Expense (14.3) (13.5) (13.0) Research & Development 16.9) 18.2) 17.6) Depreciation & Amortization (1:31 (12) (1.1) Operating Income 113 10.4 7.1 Other income Earnings Before Interest and T 11.3 10.4 7.1 Interest incomellexpense) (9.0) (7.7) (4.6) Pretax Income 2.3 27 2.5 Taxes (0.6) (0.7) (0.6) Net Income 17 2.0 19 Consolidated Balance Sheet Year Ended December 31 (in MM USD) - NO 2021 2020 2019 $24.7 $ 212 $19.5 19.6 18.5 13.2 13.9 15.3 14.3 14 20 10 59.7 57.0 48.0 Current Assets Cash Accounts Receivable Inventories Other Current Assets Total Current Assets Long-Term Assets Land Buildings Equipment Less acoumulated depreciation Net property, plant, and equipment Goodwill and intangible assets Other long-term assets Total Long Term Assets 25.5 39.7 43.2 120.0) 88.4 20.0 210 1294 22.2 36.5 39.7 (18.7) 79.7 200 210 120.7 20.7 30.5 33.2 (17.5) 66.9 20.0 14.0 100.9 Total Assets $189.1 $177.7 $148.9 Liabilities and Stockholders' E 2020 2020 2019 Current Liabilities Accounts Payable 29.3 $29.2 $24.5 Notes Payable/Short-term Debt 3.0 3.5 3.2 Current Maturities of Long-term Debt 20.0 13.3 12.3 Other Current Liabilities 14 20 4.0 53.7 48.0 44.0 104.9 99.9 76.3 Total Current Liabilities Long-Term Liabilities Long-term Debt Capital lease obligations Total Debt Deferred Taxes Other long-term liabilities Total Long Term Liabilities os 104.9 7.6 99.9 7.6 76.3 7.4 1125 107.5 83.7
Step by Step Solution
There are 3 Steps involved in it

Get step-by-step solutions from verified subject matter experts


