Complete the below table. Please include calculations for one of the columns.
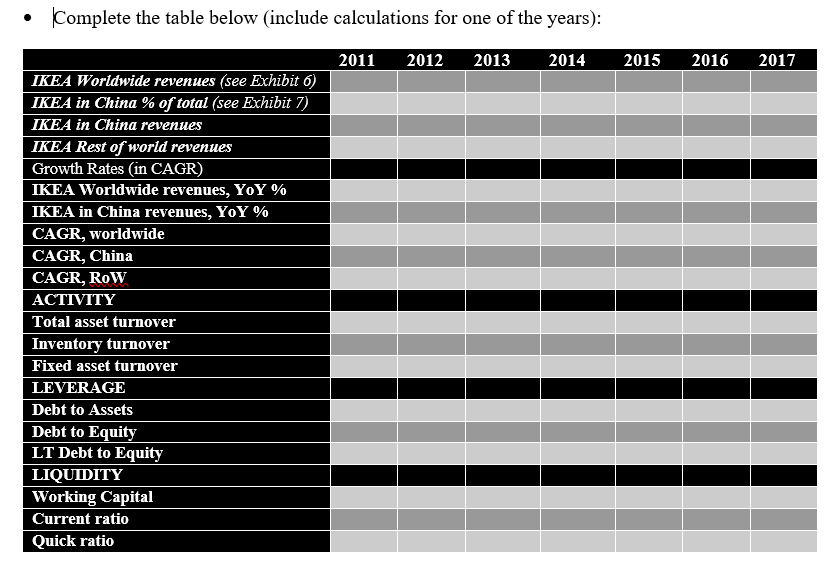
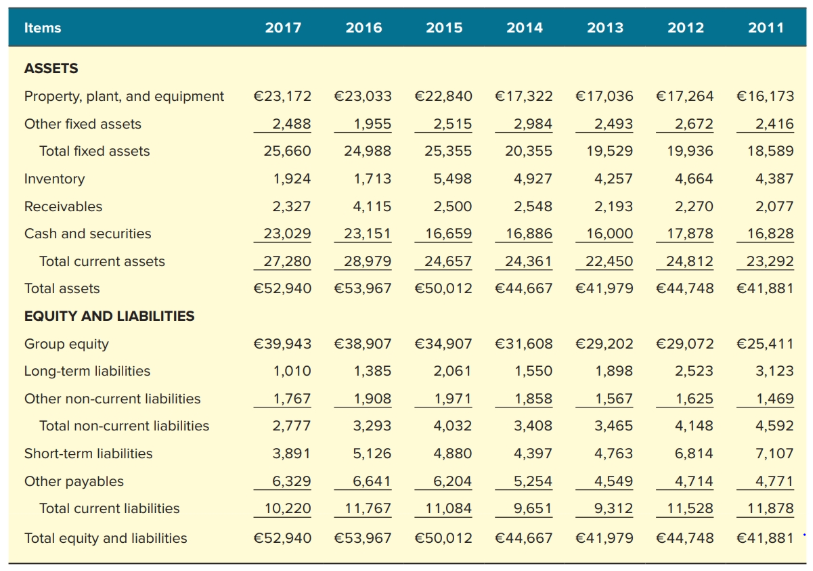
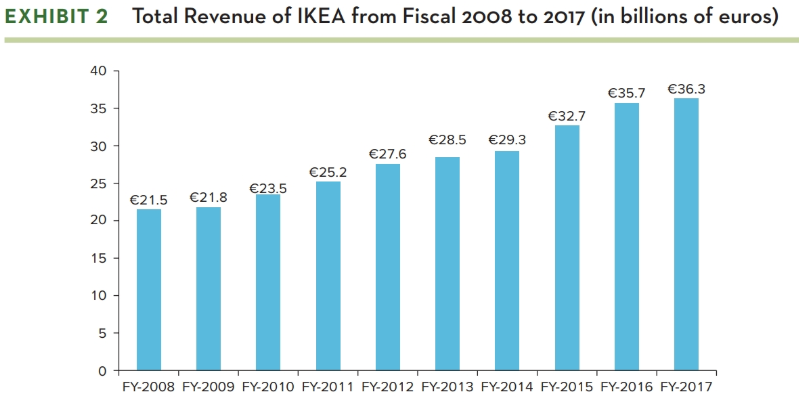
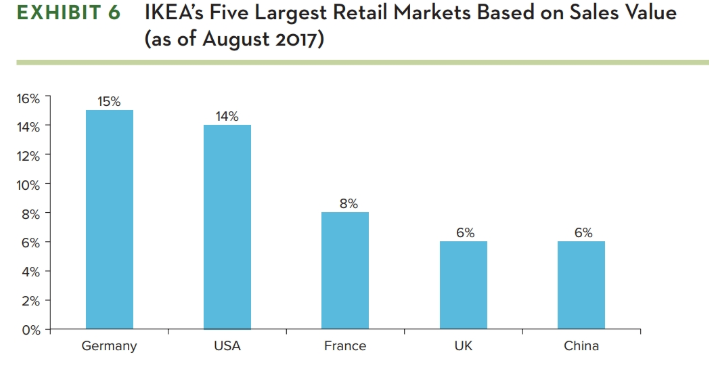
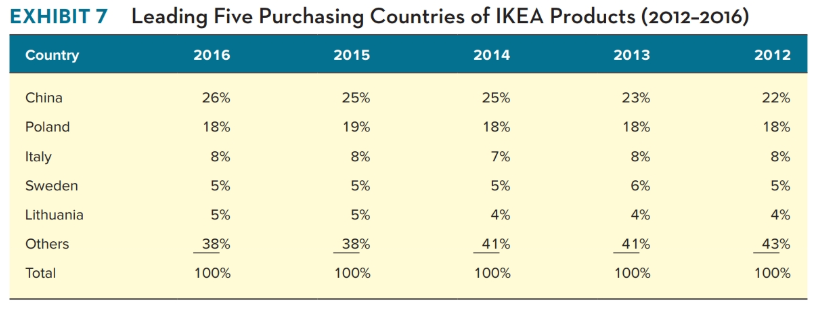
2015 2016 2017 Complete the table below (include calculations for one of the years): 2011 2012 2013 2014 IKEA Worldwide revenues (see Exhibit 6) IKEA in China % of total (see Exhibit 7) IKEA in China revenues IKEA Rest of world revenues Growth Rates (in CAGR) IKEA Worldwide revenues, YoY % IKEA in China revenues, YoY % CAGR, worldwide CAGR, China CAGR, ROW ACTIVITY Total asset turnover Inventory turnover Fixed asset turnover LEVERAGE Debt to Assets Debt to Equity LT Debt to Equity LIQUIDITY Working Capital Current ratio Quick ratio Items 2017 2016 2015 2014 2013 2012 2011 ASSETS Property, plant, and equipment Other fixed assets Total fixed assets Inventory 23,172 2,488 25,660 1,924 2,327 23,029 27,280 52,940 23,033 1,955 24,988 1,713 4,115 2 3,151 28,979 53,967 22,840 17,322 17,036 17,264 16,173 2,515 2,984 2,493 2,672 2,416 25,355 20,355 19,529 19,936 18,589 5,498 4,927 4,257 4,664 4,387 2,500 2,548 2,193 2,270 2,077 16,659 16,886 16,000 17,878 16,828 24,657 24,361 22,450 24,812 23,292 50,012 44,667 41,979 44,748 41,881 Receivables Cash and securities Total current assets Total assets EQUITY AND LIABILITIES Group equity Long-term liabilities Other non-current liabilities 1,908 Total non-current liabilities 39,943 38,907 1,010 1,385 1,767 2,777 3,293 3,891 5,126 6,329 6,641 10,220 11,767 52,940 53,967 34,907 2,061 1,971 4,032 4,880 6,204 11,084 50,012 31,608 1,550 1,858 3,408 4,397 5,254 9,651 44,667 29,202 29,072 1,898 2,523 1,567 1,625 3,465 4,148 4,763 6,814 4,549 4,714 9,312 11,528 41,979 44,748 25,411 3,123 1,469 4,592 7,107 4.771 11,878 41,881 Short-term liabilities Other payables Total current liabilities Total equity and liabilities EXHIBIT 2 Total Revenue of IKEA from Fiscal 2008 to 2017 (in billions of euros) 35.7 36.3 32.7 28.5 29.3 27.6 25.2 21.5 21.8 23.5 FY-2008 FY-2009 FY-2010 FY-2011 FY-2012 FY-2013 FY-2014 FY-2015 FY-2016 FY-2017 EXHIBIT 6 IKEA's Five Largest Retail Markets Based on Sales Value (as of August 2017) 16% 15% 14% 14% 8% 6% 6% Germany USA France UK China EXHIBIT 7 Leading Five Purchasing Countries of IKEA Products (2012-2016) Country 2016 2015 2014 2013 2012 China 26% 25% 25% 23% Poland 19% 18% Italy Sweden Lithuania Others Total 38% 41% 38% 100% 41% 100% 43% 100% 100% 100% 2015 2016 2017 Complete the table below (include calculations for one of the years): 2011 2012 2013 2014 IKEA Worldwide revenues (see Exhibit 6) IKEA in China % of total (see Exhibit 7) IKEA in China revenues IKEA Rest of world revenues Growth Rates (in CAGR) IKEA Worldwide revenues, YoY % IKEA in China revenues, YoY % CAGR, worldwide CAGR, China CAGR, ROW ACTIVITY Total asset turnover Inventory turnover Fixed asset turnover LEVERAGE Debt to Assets Debt to Equity LT Debt to Equity LIQUIDITY Working Capital Current ratio Quick ratio Items 2017 2016 2015 2014 2013 2012 2011 ASSETS Property, plant, and equipment Other fixed assets Total fixed assets Inventory 23,172 2,488 25,660 1,924 2,327 23,029 27,280 52,940 23,033 1,955 24,988 1,713 4,115 2 3,151 28,979 53,967 22,840 17,322 17,036 17,264 16,173 2,515 2,984 2,493 2,672 2,416 25,355 20,355 19,529 19,936 18,589 5,498 4,927 4,257 4,664 4,387 2,500 2,548 2,193 2,270 2,077 16,659 16,886 16,000 17,878 16,828 24,657 24,361 22,450 24,812 23,292 50,012 44,667 41,979 44,748 41,881 Receivables Cash and securities Total current assets Total assets EQUITY AND LIABILITIES Group equity Long-term liabilities Other non-current liabilities 1,908 Total non-current liabilities 39,943 38,907 1,010 1,385 1,767 2,777 3,293 3,891 5,126 6,329 6,641 10,220 11,767 52,940 53,967 34,907 2,061 1,971 4,032 4,880 6,204 11,084 50,012 31,608 1,550 1,858 3,408 4,397 5,254 9,651 44,667 29,202 29,072 1,898 2,523 1,567 1,625 3,465 4,148 4,763 6,814 4,549 4,714 9,312 11,528 41,979 44,748 25,411 3,123 1,469 4,592 7,107 4.771 11,878 41,881 Short-term liabilities Other payables Total current liabilities Total equity and liabilities EXHIBIT 2 Total Revenue of IKEA from Fiscal 2008 to 2017 (in billions of euros) 35.7 36.3 32.7 28.5 29.3 27.6 25.2 21.5 21.8 23.5 FY-2008 FY-2009 FY-2010 FY-2011 FY-2012 FY-2013 FY-2014 FY-2015 FY-2016 FY-2017 EXHIBIT 6 IKEA's Five Largest Retail Markets Based on Sales Value (as of August 2017) 16% 15% 14% 14% 8% 6% 6% Germany USA France UK China EXHIBIT 7 Leading Five Purchasing Countries of IKEA Products (2012-2016) Country 2016 2015 2014 2013 2012 China 26% 25% 25% 23% Poland 19% 18% Italy Sweden Lithuania Others Total 38% 41% 38% 100% 41% 100% 43% 100% 100% 100%