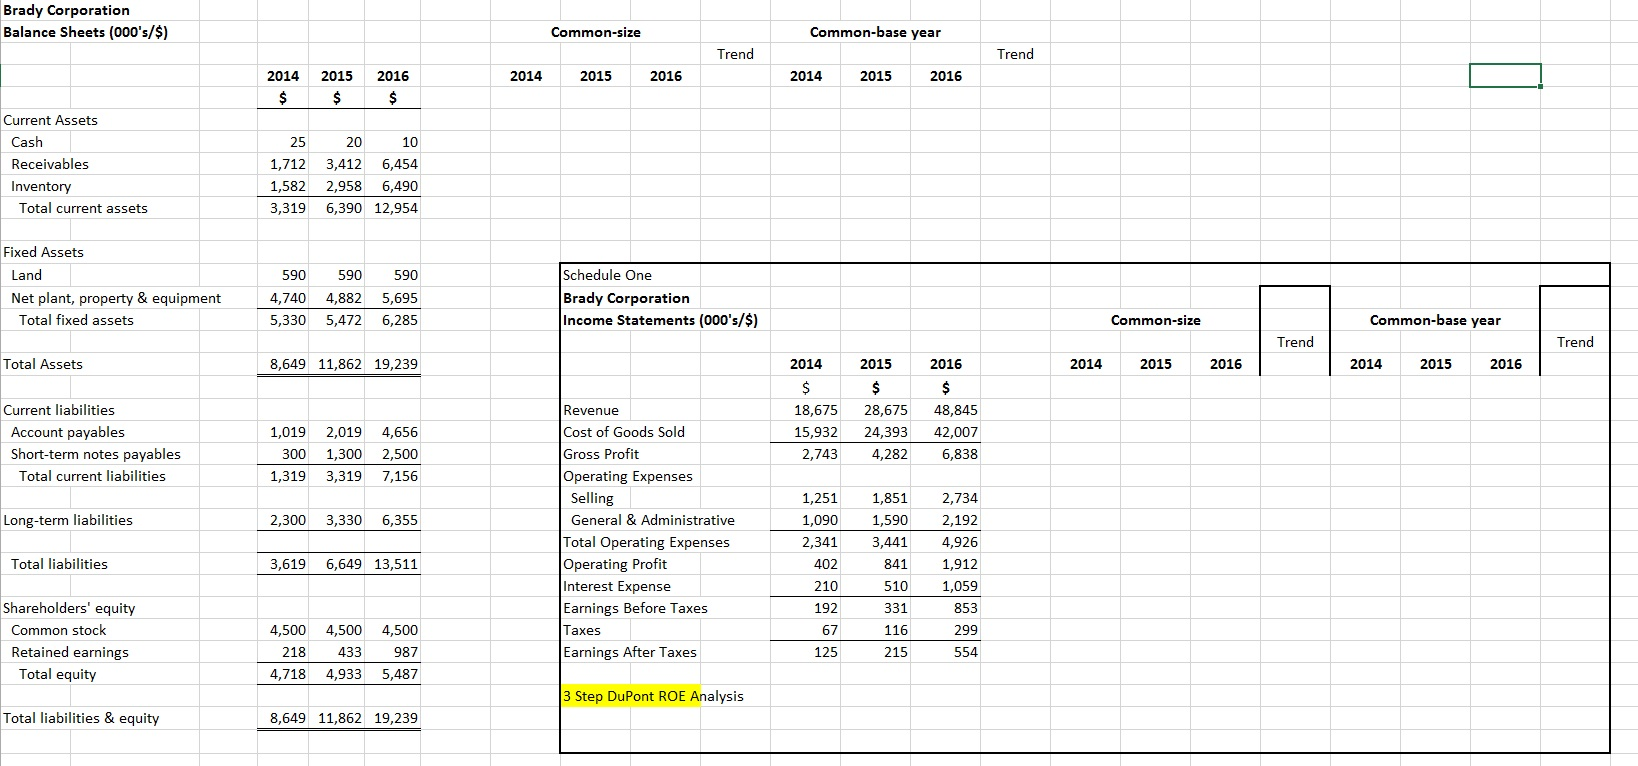
- Complete the common-size and common-base year financial statements [Income Statement (IS) and Balance Sheet (BS)] or Brady Corp. in Excel in the M2_Project_Excel file I provided. Be sure to include spark lines to easily show the trends. Write a brief analysis in the Excel worksheet of the main trends that you notice.
- Perform the 3 step DuPont Return on Equity (ROE) analysis for Brady Corp. using cell references. Write a brief analysis of what you learn from the DuPont analysis on your Excel worksheet.
Brady Corporation Balance Sheets (000's/$) Common-size Common-base year Trend Trend 2014 2015 2016 2014 2015 2016 2014 $ 2015 $ 2016 $ Current Assets Cash Receivables Inventory Total current assets 25 1,712 1,582 3,319 20 10 3,412 6,454 2,958 6,490 6,390 12,954 Fixed Assets Land Net plant, property & equipment Total fixed assets 590 4,740 5,330 590 4,882 5,472 590 5,695 6,285 Schedule One Brady Corporation Income Statements (000's/$) Common-size Common-base year Trend Trend Total Assets 8,649 11,862 19,239 2014 2015 2016 2014 2015 2016 2014 2015 2016 $ Current liabilities Account payables Short-term notes payables Total current liabilities $ 18,675 15,932 2,743 $ 28,675 24,393 4,282 1,019 300 2,019 1,300 3,319 4,656 2,500 7,156 48,845 42,007 6,838 1,319 Long-term liabilities 2,300 3,330 6,355 Revenue Cost of Goods Sold Gross Profit Operating Expenses Selling General & Administrative Total Operating Expenses Operating Profit Interest Expense Earnings Before Taxes Taxes Earnings After Taxes 1,251 1,090 2,341 402 210 192 2,734 2,192 4,926 1,912 1,059 853 Total liabilities 3,619 1,851 1,590 3,441 841 510 331 116 215 6,649 13,511 4,500 67 Shareholders' equity Common stock Retained earnings Total equity 4,500 218 4,718 4,500 433 4,933 299 554 125 987 5,487 3 Step DuPont ROE Analysis Total liabilities & equity 8,649 11,862 19,239 Brady Corporation Balance Sheets (000's/$) Common-size Common-base year Trend Trend 2014 2015 2016 2014 2015 2016 2014 $ 2015 $ 2016 $ Current Assets Cash Receivables Inventory Total current assets 25 1,712 1,582 3,319 20 10 3,412 6,454 2,958 6,490 6,390 12,954 Fixed Assets Land Net plant, property & equipment Total fixed assets 590 4,740 5,330 590 4,882 5,472 590 5,695 6,285 Schedule One Brady Corporation Income Statements (000's/$) Common-size Common-base year Trend Trend Total Assets 8,649 11,862 19,239 2014 2015 2016 2014 2015 2016 2014 2015 2016 $ Current liabilities Account payables Short-term notes payables Total current liabilities $ 18,675 15,932 2,743 $ 28,675 24,393 4,282 1,019 300 2,019 1,300 3,319 4,656 2,500 7,156 48,845 42,007 6,838 1,319 Long-term liabilities 2,300 3,330 6,355 Revenue Cost of Goods Sold Gross Profit Operating Expenses Selling General & Administrative Total Operating Expenses Operating Profit Interest Expense Earnings Before Taxes Taxes Earnings After Taxes 1,251 1,090 2,341 402 210 192 2,734 2,192 4,926 1,912 1,059 853 Total liabilities 3,619 1,851 1,590 3,441 841 510 331 116 215 6,649 13,511 4,500 67 Shareholders' equity Common stock Retained earnings Total equity 4,500 218 4,718 4,500 433 4,933 299 554 125 987 5,487 3 Step DuPont ROE Analysis Total liabilities & equity 8,649 11,862 19,239


