

Answered step by step
Verified Expert Solution
Question
1 Approved Answer
Complete the financial projections and provide assumptions and critical risks that may or may not affect the success of this startup business. 5 2021 %
Complete the financial projections and provide assumptions and critical risks that may or may not affect the success of this startup business.
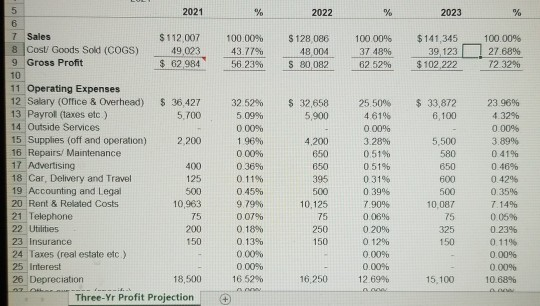
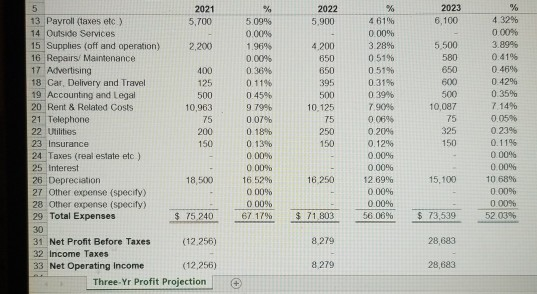
5 2021 % 2022 % 2023 % B 100.00% 43.77% 56.23% S 128 086 48 004 S 80 082 100.00% 37 48% 62.52% $141,345 39,123 $ 102 222 100.00% 27.68% 72.32% $ 32,658 5.900 $ 33,872 6.100 7 Sales $112.007 8 Cost Goods Sold (COGS) 49,023 9 Gross Profit $ 62 984 10 11 Operating Expenses 12 Salary (olce & Overhead) $ 36,427 13 Payroll (taxes etc) 5.700 14 Outside Services 15 Supplies (off and operation) 2,200 16 Repairs/ Maintenance 17 Advertising 400 18 Car. Delivery and Travel 125 19 Accounting and Legal 500 20 Rent & Related Costs 10,963 21 Telephone 75 22 Utilities 200 23 Insurance 150 24 Taxes (real estate etc ) 25 Interest 26 Depreciation 18,500 Three-Yr Profit Projection 5,500 580 650 600 32.52% 5.09% 0.00% 1 96% 0.00% 0.36% 0 11% 0.45% 9.79% 0.07% 0.18% 0.13% 0.00% 0.00% 16 52% 4,200 650 650 395 500 10.125 75 250 25.50% 46196 0.00% 3.28% 0.51% 0.51% 0.31% 0.39% 7.90% 0.06% 0.20% 0 12% 0.00% 0.00% 12 69% 500 23.96% 4.32% 0.00% 3.89% 041% 0.46% 0.42% 0.35% 7.14% 0.05% 0.23% 0.11% 0.00% 0.00% 10.68% 10.087 75 325 150 150 16,250 15.100 + 2023 2022 5,900 6,100 5 2021 13 Payroll (taxes etc.) 5,700 14 Outside Services 15 Supplies (off and operation) 2,200 16 Repairs/ Maintenance 17 Advertising 400 18 Car, Delivery and Travel 125 19 Accounting and Legal 500 20 Rent & Related Costs 10,963 21 Telephone 75 22 Utilities 200 23 Insurance 150 24 Taxes (real estate etc) 25 Interest 26 Depreciation 18,500 27 Other expense (specity) 28 Other expense (specily) 29 Total Expenses $ 75,240 30 31 Net Profit Before Taxes (12.256) 32 Income Taxes 33 Net Operating Income (12,256) Three-Yr Profit Projection % 5.09% 0.00% 1.969 0.0096 0.36% 0.11% 0.45% 97996 0.07% 0.18% 0.13% 0.00% 0.00% 16.52% 0.00% 000% 67 17% 4200 650 650 395 500 10.125 75 250 150 % 4 61% 0.00% 3.28% 0 51% 0.51% 0.31% 0.39% 7.90% 0.0696 0.20% 0.12% 0.00% 0.00% 12.69% 0.00% 0.00% 56.06% 5.500 580 650 600 500 10,087 75 325 150 % 4 32% 0.00% 3.89% 0.41% 0.46% 0.4296 0.35% 7.14% 0.05% 0.23% 0.11% 0.00% 0.00% 10 68% 0.00% 0.00% 52.03% 18 250 15,100 $ 71 803 $ 73,539 8 279 28,683 8 279 28,683 + 5 2021 % 2022 % 2023 % B 100.00% 43.77% 56.23% S 128 086 48 004 S 80 082 100.00% 37 48% 62.52% $141,345 39,123 $ 102 222 100.00% 27.68% 72.32% $ 32,658 5.900 $ 33,872 6.100 7 Sales $112.007 8 Cost Goods Sold (COGS) 49,023 9 Gross Profit $ 62 984 10 11 Operating Expenses 12 Salary (olce & Overhead) $ 36,427 13 Payroll (taxes etc) 5.700 14 Outside Services 15 Supplies (off and operation) 2,200 16 Repairs/ Maintenance 17 Advertising 400 18 Car. Delivery and Travel 125 19 Accounting and Legal 500 20 Rent & Related Costs 10,963 21 Telephone 75 22 Utilities 200 23 Insurance 150 24 Taxes (real estate etc ) 25 Interest 26 Depreciation 18,500 Three-Yr Profit Projection 5,500 580 650 600 32.52% 5.09% 0.00% 1 96% 0.00% 0.36% 0 11% 0.45% 9.79% 0.07% 0.18% 0.13% 0.00% 0.00% 16 52% 4,200 650 650 395 500 10.125 75 250 25.50% 46196 0.00% 3.28% 0.51% 0.51% 0.31% 0.39% 7.90% 0.06% 0.20% 0 12% 0.00% 0.00% 12 69% 500 23.96% 4.32% 0.00% 3.89% 041% 0.46% 0.42% 0.35% 7.14% 0.05% 0.23% 0.11% 0.00% 0.00% 10.68% 10.087 75 325 150 150 16,250 15.100 + 2023 2022 5,900 6,100 5 2021 13 Payroll (taxes etc.) 5,700 14 Outside Services 15 Supplies (off and operation) 2,200 16 Repairs/ Maintenance 17 Advertising 400 18 Car, Delivery and Travel 125 19 Accounting and Legal 500 20 Rent & Related Costs 10,963 21 Telephone 75 22 Utilities 200 23 Insurance 150 24 Taxes (real estate etc) 25 Interest 26 Depreciation 18,500 27 Other expense (specity) 28 Other expense (specily) 29 Total Expenses $ 75,240 30 31 Net Profit Before Taxes (12.256) 32 Income Taxes 33 Net Operating Income (12,256) Three-Yr Profit Projection % 5.09% 0.00% 1.969 0.0096 0.36% 0.11% 0.45% 97996 0.07% 0.18% 0.13% 0.00% 0.00% 16.52% 0.00% 000% 67 17% 4200 650 650 395 500 10.125 75 250 150 % 4 61% 0.00% 3.28% 0 51% 0.51% 0.31% 0.39% 7.90% 0.0696 0.20% 0.12% 0.00% 0.00% 12.69% 0.00% 0.00% 56.06% 5.500 580 650 600 500 10,087 75 325 150 % 4 32% 0.00% 3.89% 0.41% 0.46% 0.4296 0.35% 7.14% 0.05% 0.23% 0.11% 0.00% 0.00% 10 68% 0.00% 0.00% 52.03% 18 250 15,100 $ 71 803 $ 73,539 8 279 28,683 8 279 28,683 +
Step by Step Solution
There are 3 Steps involved in it
Step: 1

Get Instant Access to Expert-Tailored Solutions
See step-by-step solutions with expert insights and AI powered tools for academic success
Step: 2

Step: 3
Ace Your Homework with AI
Get the answers you need in no time with our AI-driven, step-by-step assistance
Get Started
Optimization Methods In Finance
Authors: Gerard Cornuejols, Reha Tütüncü
1st Edition
0521861705, 978-0521861700