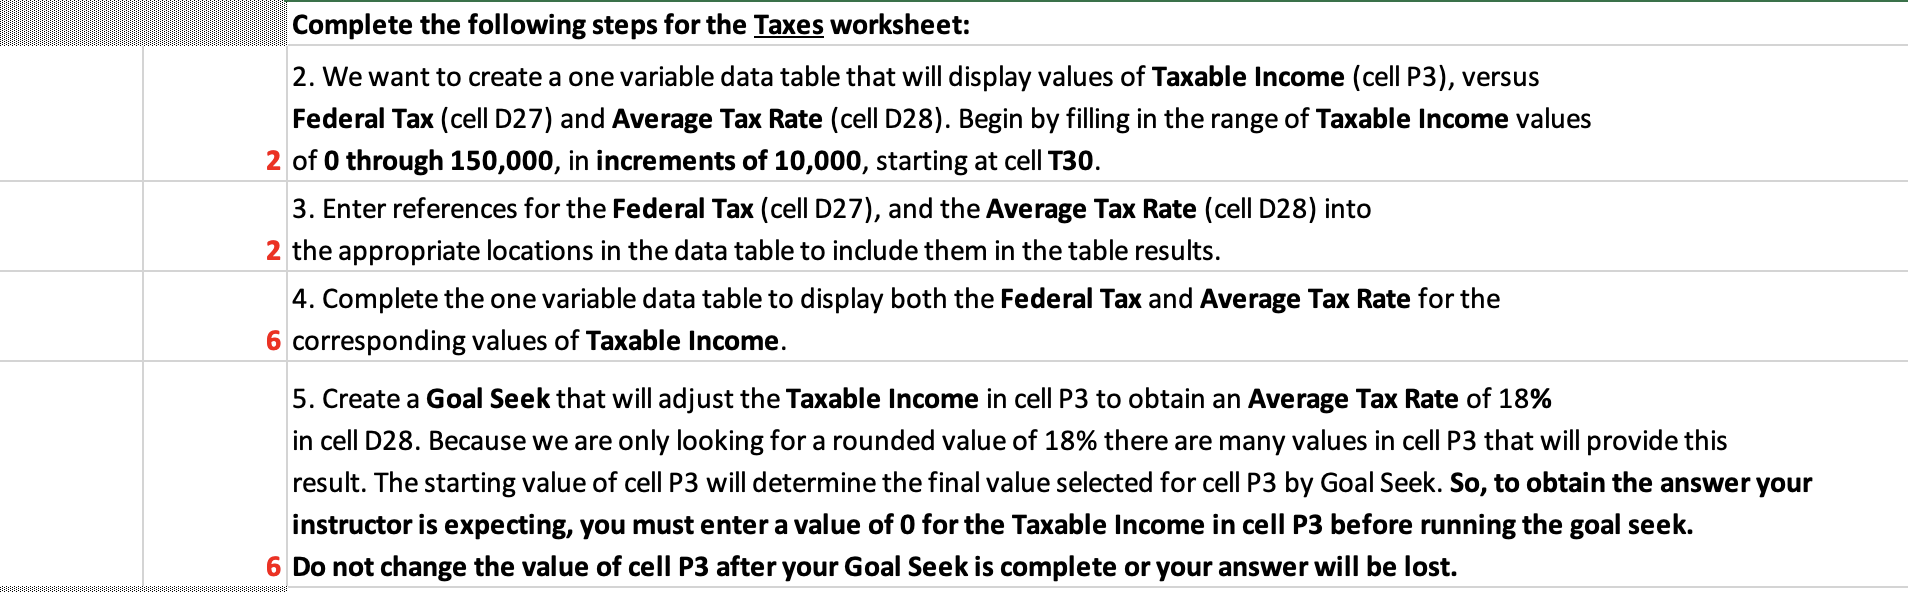
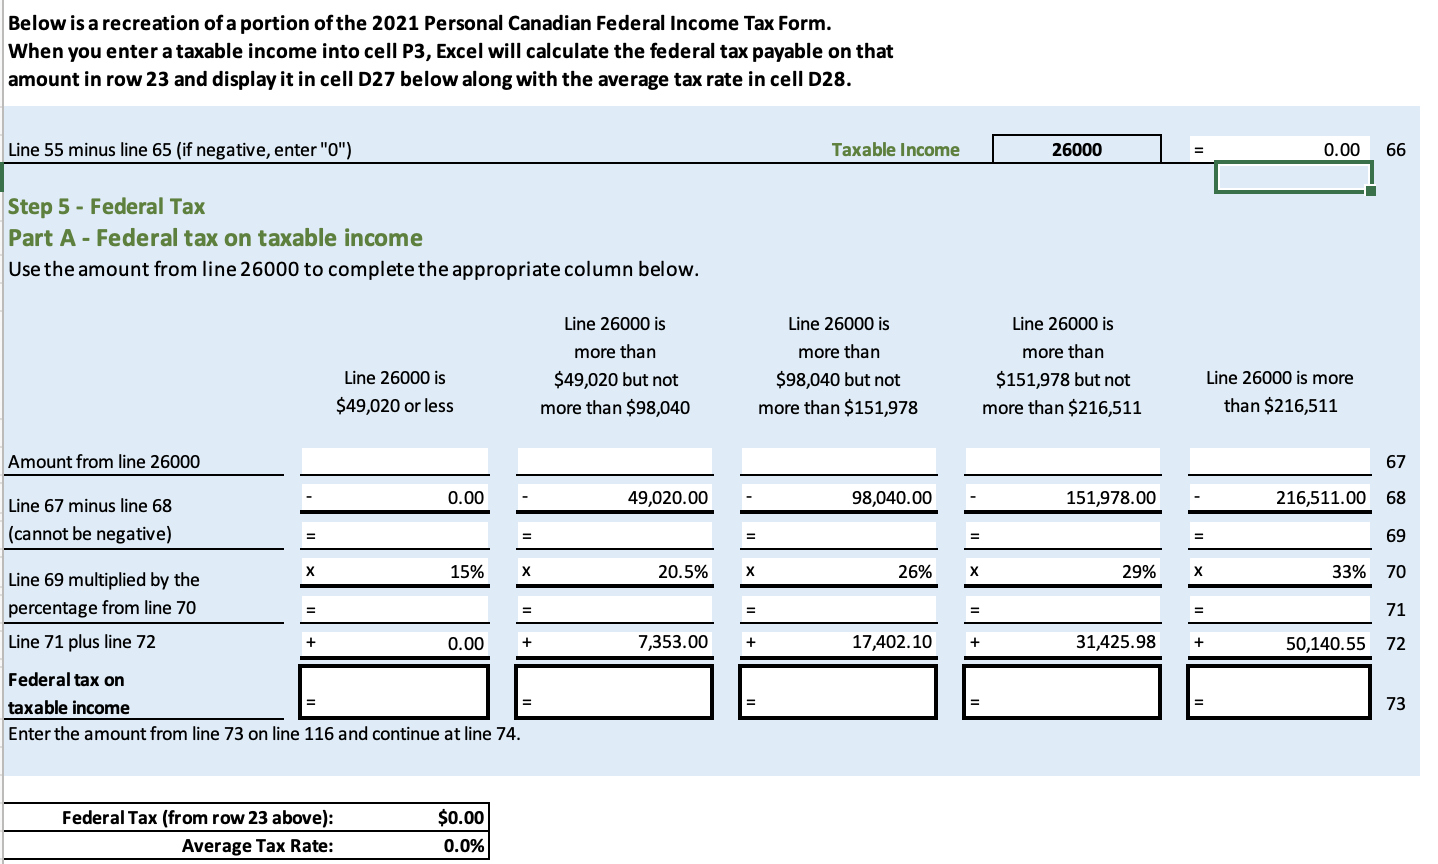

Complete the following steps for the Taxes worksheet: 2. We want to create a one variable data table that will display values of Taxable Income (cell P3), versus Federal Tax (cell D27) and Average Tax Rate (cell D28). Begin by filling in the range of Taxable Income values of 0 through 150,000, in increments of 10,000 , starting at cell T30. 3. Enter references for the Federal Tax (cell D27), and the Average Tax Rate (cell D28) into the appropriate locations in the data table to include them in the table results. 4. Complete the one variable data table to display both the Federal Tax and Average Tax Rate for the corresponding values of Taxable Income. 5. Create a Goal Seek that will adjust the Taxable Income in cell P3 to obtain an Average Tax Rate of 18% in cell D28. Because we are only looking for a rounded value of 18% there are many values in cell P3 that will provide this result. The starting value of cell P3 will determine the final value selected for cell P3 by Goal Seek. So, to obtain the answer you instructor is expecting, you must enter a value of 0 for the Taxable Income in cell P3 before running the goal seek. Do not change the value of cell P3 after your Goal Seek is complete or your answer will be lost. Below is a recreation of a portion of the 2021 Personal Canadian Federal Income Tax Form. When you enter a taxable income into cell P3, Excel will calculate the federal tax payable on that amount in row 23 and display it in cell D27 below along with the average tax rate in cell D28. Complete the following steps for the Taxes worksheet: 2. We want to create a one variable data table that will display values of Taxable Income (cell P3), versus Federal Tax (cell D27) and Average Tax Rate (cell D28). Begin by filling in the range of Taxable Income values of 0 through 150,000, in increments of 10,000 , starting at cell T30. 3. Enter references for the Federal Tax (cell D27), and the Average Tax Rate (cell D28) into the appropriate locations in the data table to include them in the table results. 4. Complete the one variable data table to display both the Federal Tax and Average Tax Rate for the corresponding values of Taxable Income. 5. Create a Goal Seek that will adjust the Taxable Income in cell P3 to obtain an Average Tax Rate of 18% in cell D28. Because we are only looking for a rounded value of 18% there are many values in cell P3 that will provide this result. The starting value of cell P3 will determine the final value selected for cell P3 by Goal Seek. So, to obtain the answer you instructor is expecting, you must enter a value of 0 for the Taxable Income in cell P3 before running the goal seek. Do not change the value of cell P3 after your Goal Seek is complete or your answer will be lost. Below is a recreation of a portion of the 2021 Personal Canadian Federal Income Tax Form. When you enter a taxable income into cell P3, Excel will calculate the federal tax payable on that amount in row 23 and display it in cell D27 below along with the average tax rate in cell D28