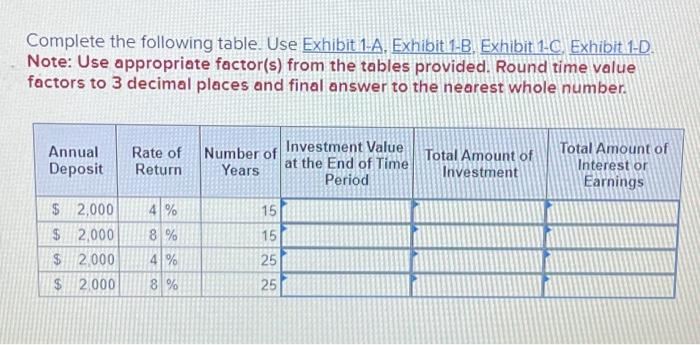
Complete the following table. Use Exhibit 1-A, Exhibit 1-B, Exhibit 1-C, Exhibit 1-D. Note: Use appropriate factor(s) from the tables provided. Round time value factors to 3 decimal places and final answer to the nearest whole number. Annual Deposit $ 2,000 $ 2,000 $ 2,000 2.000 69 Rate of Return 4% 8% 4 % 8 % Number of Years 15 15 25 25 Investment Value at the End of Time Period Total Amount of Investment Total Amount of Interest or Earnings
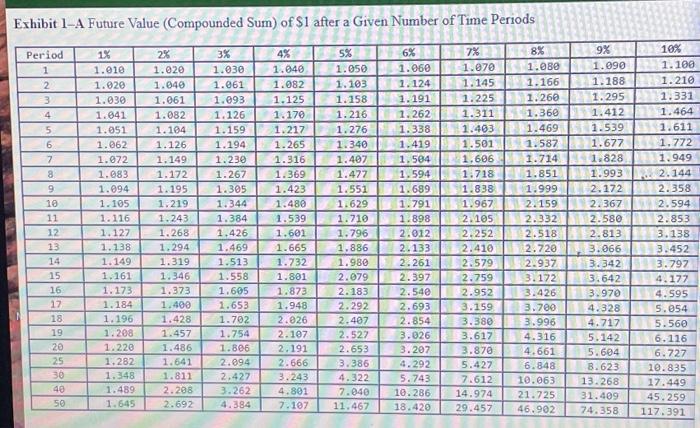
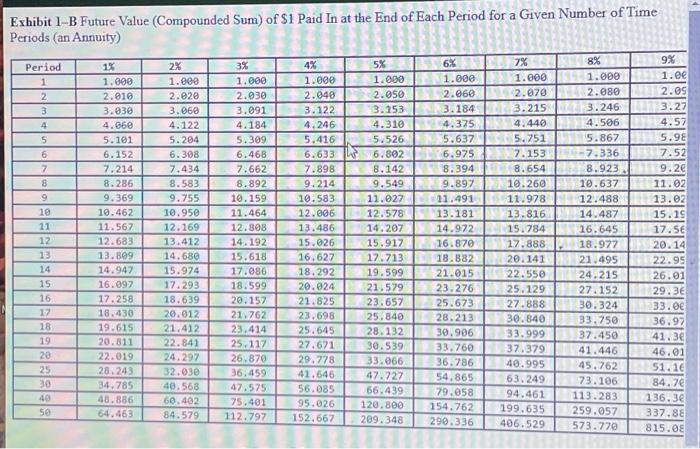
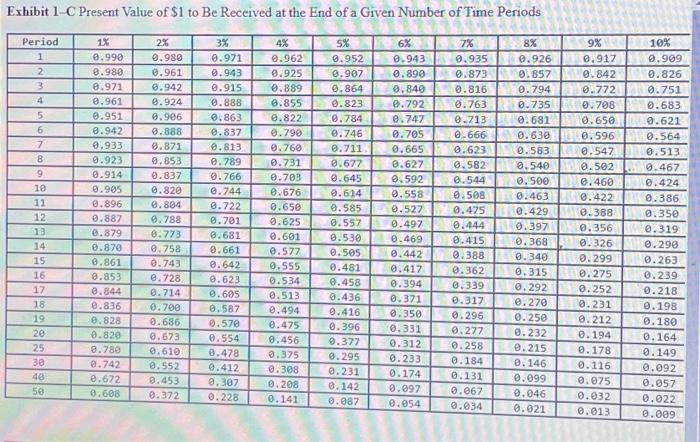
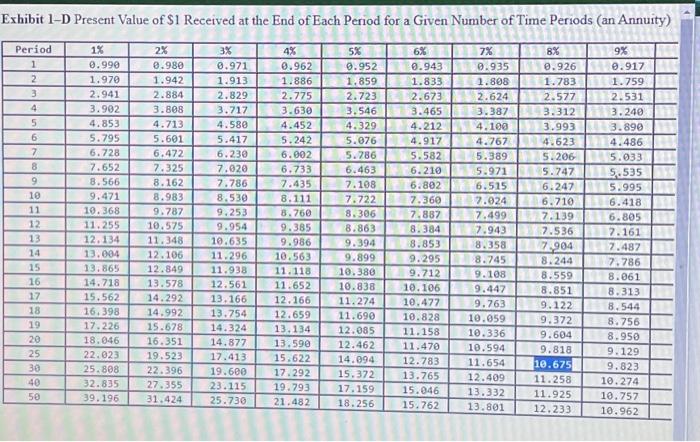
Complete the following table. Use Exhibit 1-A, Exhibit 1-B, Exhibit 1-C, Exhibit 1-D. Note: Use appropriate factor(s) from the tables provided. Round time value factors to 3 decimal places and final answer to the nearest whole number. Exhibit 1-C Present Value of $1 to Be Received at the End of a Given Number of Time Periods Exhibit 1-B Future Value (Compounded Sum) of $1 Paid In at the End of Each Period for a Given Number of Time Periods (an Annuitv) Exhibit 1-D Present Value of $1 Received at the End of Each Period for a Given Number of Time Periods (an Annuity) \begin{tabular}{|c|c|c|c|c|c|c|c|c|c|c|} \hline Period & 1% & 2x & 38 & 4% & 5x & 6% & 7% & 8% & 9% & \\ \hline 1 & 0.990 & 0.980 & 0.971 & 0.962 & 0.952 & 0.943 & 0.935 & 0.926 & 0.917 & \\ \hline 2 & 1.970 & 1.942 & 1.913 & 1.886 & 1.859 & 1.833 & 1.808 & 1.783 & 1.759 & \\ \hline 3 & 2.941 & 2.884 & 2.829 & 2.775 & 2.723 & 2.673 & 2.624 & 2.577 & 2.531 & \\ \hline 4 & 3.902 & 3.808 & 3.717 & 3.630 & 3.546 & 3.465 & 3.387 & 3.312 & 3.240 & \\ \hline 5 & 4.853 & 4.713 & 4.580 & 4.452 & 4.329 & 4.212 & 4.100 & 3.993 & 3.890 & \\ \hline 6 & 5.795 & 5.601 & 5.417 & 5.242 & 5.076 & 4.917 & 4.767 & 4.623 & 4.486 & \\ \hline 7 & 6.728 & 6.472 & 6.230 & 6.002 & 5.786 & 5.582 & 5.389 & 5.206 & 5.033 & \\ \hline 8 & 7.652 & 7.325 & 7.020 & 6.733 & 6.463 & 6.210 & 5.971 & 5.747 & 5.535 & \\ \hline 9 & 8.566 & 8.162 & 7.786 & 7.435 & 7.108 & 6.802 & 6.515 & 6.247 & 5.995 & \\ \hline 10 & 9.471 & 8.983 & 8.530 & 8.111 & 7.722 & 7.360 & 7.024 & 6.710 & 6.418 & \\ \hline 11 & 10.368 & 9.787 & 9.253 & 8.760 & 8.306 & 7.887 & 7.499 & 7.139 & 6.805 & \\ \hline 12 & 11.255 & 10.575 & 9.954 & 9.385 & 8.863 & 8.384 & 7.943 & 7.536 & 7.161 & \\ \hline 13 & 12.134 & 11.348 & 10.635 & 9.986 & 9.394 & 8.853 & 8.358 & 7,204 & 7.487 & \\ \hline 14 & 13.004 & 12.106 & 11.296 & 10.563 & 9.899 & 9.295 & 8.745 & 8.244 & 7.786 & \\ \hline 15 & 13.865 & 12.849 & 11.938 & 11.118 & 10.380 & 9.712 & 9.108 & 8.559 & 8.061 & \\ \hline 16 & 14.718 & 13.578 & 12.561 & 11.652 & 10.838 & 10.106 & 9.447 & 8.851 & 8.313 & \\ \hline 17 & 15.562 & 14.292 & 13.166 & 12,166 & 11.274 & 10.477 & 9.763 & 9.122 & 8.544 & \\ \hline 18 & 16,398 & 14.992 & 13.754 & 12.659 & 11.690 & 10.828 & 10.059 & 9.372 & 8.756 & \\ \hline 19 & 17.226 & 15.678 & 14.324 & 13.134 & 12.085 & 11.158 & 10.336 & 9.604 & 8.950 & \\ \hline 20 & 18.046 & 16.351 & 14.877 & 13.590 & 12.462 & 11.470 & 10.594 & 9.818 & 9.129 & \\ \hline 25 & 22.023 & 19.523 & 17.413 & 15.622 & 14.094 & 12.783 & 11.654 & 10.675 & 9.823 & \\ \hline 30 & 25.868 & 22.396 & 19.600 & 17.292 & 15.372 & 13.765 & 12.409 & 11.258 & 10.274 & \\ \hline 40 & 32.835 & 27.355 & 23.115 & 19.793 & 17.159 & 15.046 & 13.332 & 11.925 & 10.757 & \\ \hline 50 & 39.196 & 31.424 & 25.730 & 21.482 & 18.256 & 15.762 & 13.801 & 12.233 & 10.962 & \\ \hline \end{tabular} Exhibit 1-A Future Value (Compounded Sum) of $1 after a Given Number of Time Periods
