Answered step by step
Verified Expert Solution
Question
1 Approved Answer
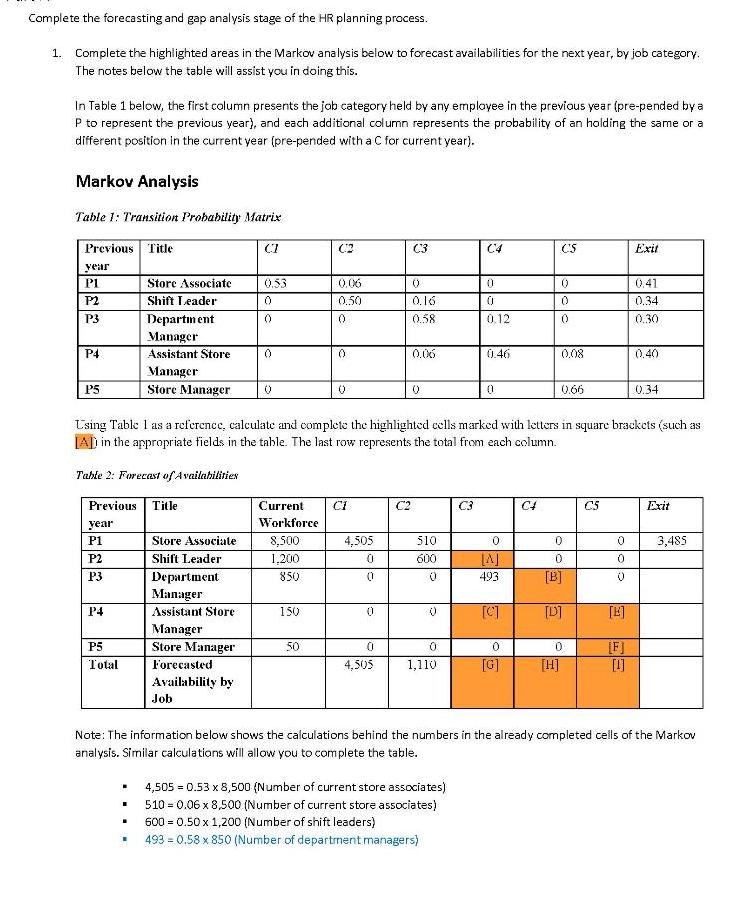
Complete the forecasting and gap analysis stage of the HR planning process. 1. Complete the highlighted areas in the Markov analysis below to forecast


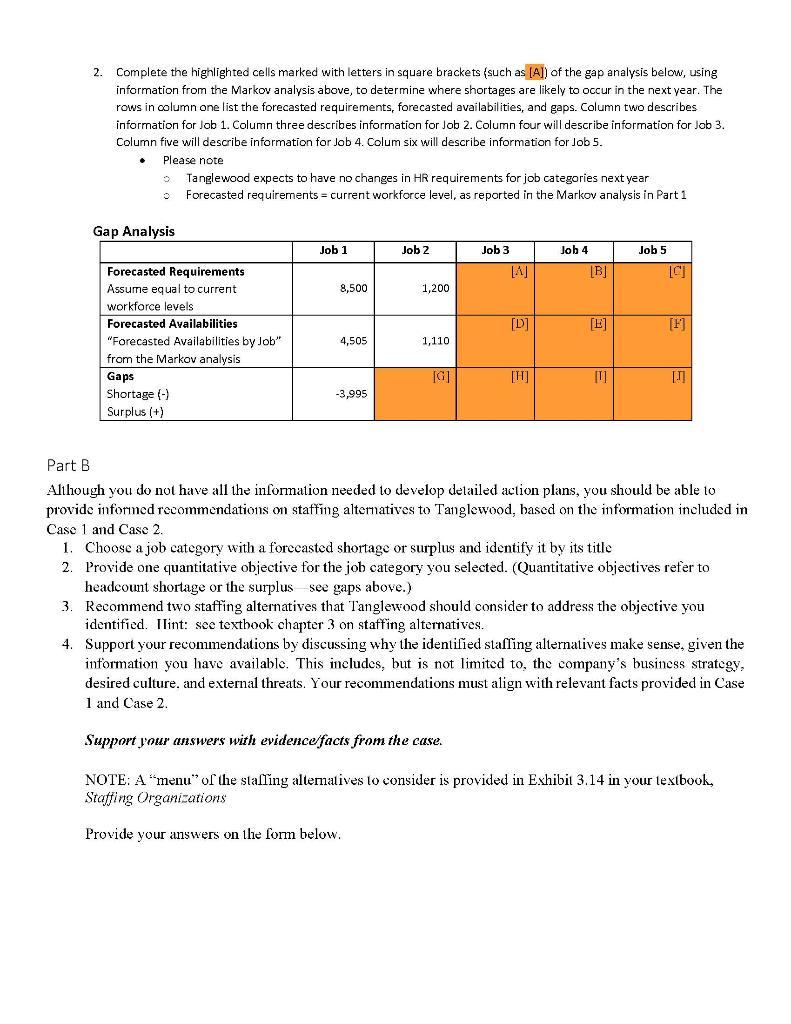
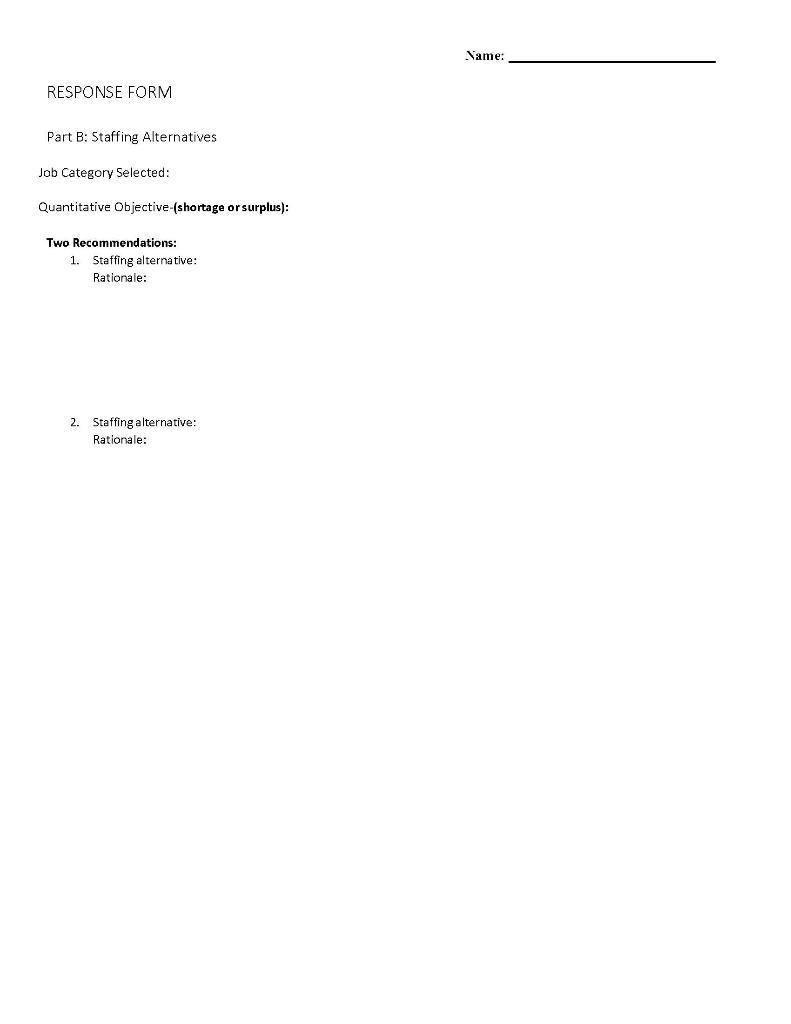
Complete the forecasting and gap analysis stage of the HR planning process. 1. Complete the highlighted areas in the Markov analysis below to forecast availabilities for the next year, by job category. The notes below the table will assist you in doing this. In Table 1 below, the first column presents the job category held by any employee in the previous year (pre-pended by a P to represent the previous year), and each additional column represents the probability of an holding the same or a different position in the current year (pre-pended with a C for current year). Markov Analysis Table 1: Transition Probability Matrix Previous Title year P1 P2 P3 P4 P5 P2 P3 Previous Title year P1 P4 P5 Total . Store Associate Shift Leader I . T Department Manager Assistant Store Manager Store Manager 0 (7 Store Associate Shift Leader 0.53 0 Department Manager Assistant Store Manager Store Manager Forecasted Availability by Job 0 0 Current Workforce 8,500 1.200 850 150 (2 50 0.06 0.50 0 0 0 CI 4,505 0 0 Using Table 1 as a reference, calculate and complete the highlighted cells marked with letters in square brackets (such as [A] in the appropriate fields in the table. The last row represents the total from each column. Table 2: Forecast of Availabilities 0 0 4,505 C3 C2 ( 0.16 0.58 0.06 ( 510 600 0 0 1,110 C4 C3 4,505 = 0.53 x 8,500 (Number of current store associates) 510 = 0.06 x 8,500 (Number of current store associates) 600 = 0.50 x 1,200 (Number of shift leaders) 493 0.58 x 850 (Number of department managers) 0 0 0.12 0.46 0 0 [A] 493 [C] [G] C4 2 CS 0 0 0 0.08 [H] 0.66 0 0 [B] [D] 0 CS 0 0 0 Exit [E] [F] [4] 0.41 0.34 0.30 0.40 Note: The information below shows the calculations behind the numbers in the already completed cells of the Markov analysis. Similar calculations will allow you to complete the table. 0.34 Exit 3,485 2. Complete the highlighted cells marked with letters in square brackets (such as [A]) of the gap analysis below, using information from the Markov analysis above, to determine where shortages are likely to occur in the next year. The rows in column one list the forecasted requirements, forecasted availabilities, and gaps. Column two describes information for Job 1. Column three describes information for Job 2. Column four will describe information for Job 3. Column five will describe information for Job 4. Colum six will describe information for Job 5. Please note Tanglewood expects to have no changes in HR requirements for job categories next year Forecasted requirements = current workforce level, as reported in the Markov analysis in Part 1 O Gap Analysis Forecasted Requirements Assume equal to current workforce levels Forecasted Availabilities "Forecasted Availabilities by Job" from the Markov analysis Gaps Shortage (-) Surplus (+) Job 1 8,500 4,505 -3,995 Job 2 1,200 1,110 [G] Job 3 [D] [H] Job 4 [B] [E] [1] Job 5 [C] [F] [J] Part B. Although you do not have all the information needed to develop detailed action plans, you should be able to provide informed recommendations on staffing alternatives to Tanglewood, based on the information included in Case 1 and Case 2. 1. Choose a job category with a forecasted shortage or surplus and identify it by its title 2. Provide one quantitative objective for the job category you selected. (Quantitative objectives refer to headcount shortage or the surplus see gaps above.) 3. Recommend two staffing alternatives that Tanglewood should consider to address the objective you identified. Ilint: see textbook chapter 3 on staffing alternatives. 4. Support your recommendations by discussing why the identified staffing alternatives make sense, given the information you have available. This includes, but is not limited to, the company's business strategy, desired culture, and external threats. Your recommendations must align with relevant facts provided in Case 1 and Case 2. Support your answers with evidence/facts from the case. NOTE: A "menu" of the staffing alternatives to consider is provided in Exhibit 3.14 in your textbook, Staffing Organizations Provide your answers on the form below. RESPONSE FORM Part B: Staffing Alternatives Job Category Selected: Quantitative Objective-(shortage or surplus): Two Recommendations: 1. Staffing alternative: Rationale: 2. Staffing alternative: Rationale: Name:
Step by Step Solution
★★★★★
3.45 Rating (168 Votes )
There are 3 Steps involved in it
Step: 1

Get Instant Access to Expert-Tailored Solutions
See step-by-step solutions with expert insights and AI powered tools for academic success
Step: 2

Step: 3

Ace Your Homework with AI
Get the answers you need in no time with our AI-driven, step-by-step assistance
Get Started


