Question
Complete the function load_data below to load three datasets that we will use in subsequent questions. Be sure to follow the instructions below for each
Complete the function load_data below to load three datasets that we will use in subsequent questions. Be sure to follow the instructions below for each dataset respectively.
-
First import the US_States_Visited_2017.xlsx, US_States_Visited_2018.xlsx and US_States_Visited_2019.xlsx datasets. You may start with read_excel() function in pandas and remove the top and bottom rows.
-
After that, you will need to multiply all the visitation numbers by 1,000. For example, in 2016, the recorded visitation for Alabama state was supposed to be 141,000 after multiplying 1,000. This must be applied to all 3 datasets.
-
Finally, you should merge the 3 datasets together, and rename the merged dataset called merged_US_states_visitation. The merged dataset should retain only the census states called state, 2016 visitation data called visitation_2016, 2017 visitation data called visitation_2017, 2018 visitation data called visitation_2018and 2019 visitation data called visitation_2019. To avoid confusion, when we join the datasets, keep every state that ever has international visitation data. Finally, order the state names alphabetically.
#CODE HERE import numpy as np import matplotlib.pyplot as plt import pandas as pd import datetime
def load_data():
return None load_data().head(25)
All datasets look exactly like this:
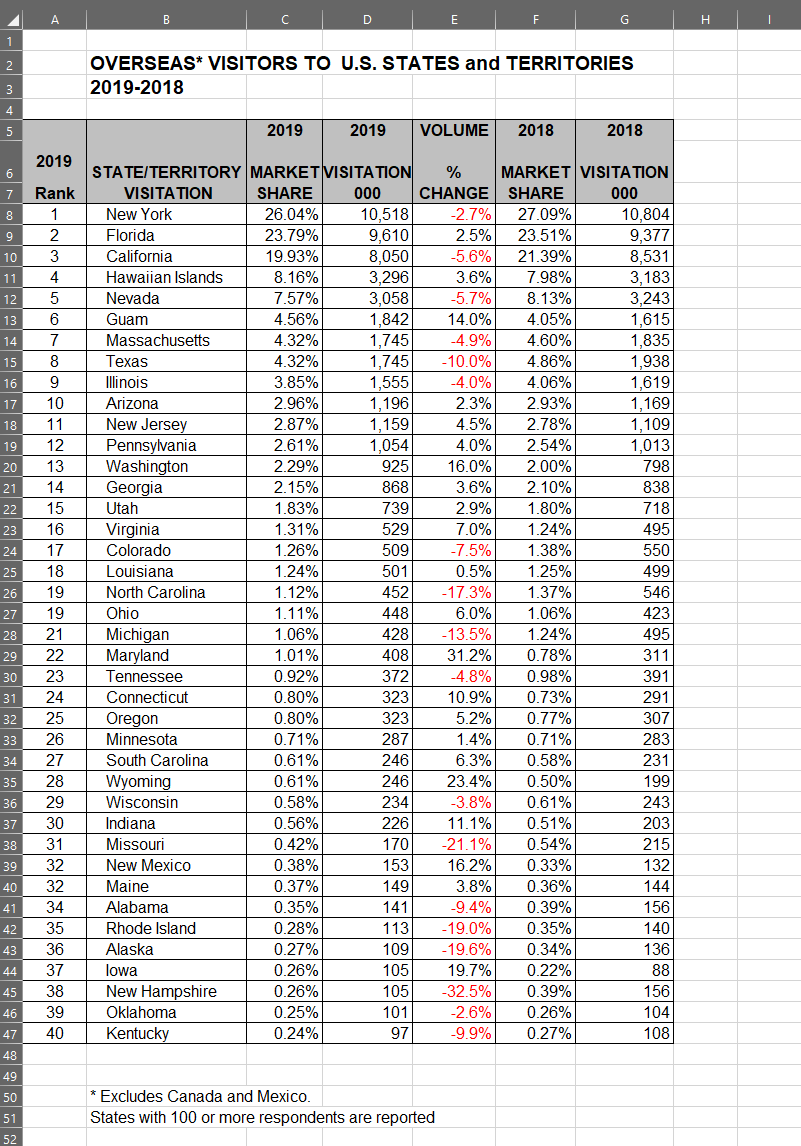
G H I 1 2 OVERSEAS* VISITORS TO U.S. STATES and TERRITORIES 2019-2018 3 4 5 2019 2019 VOLUME 2018 2018 2019 6 7 Rank 1 2 3 4 5 6 7 8 9 9 10 11 12 13 14 15 16 17 18 19 20 21 22 23 24 25 26 27 28 29 30 31 32 33 34 35 36 37 38 39 40 10 11 12 13 14 15 16 17 18 19 19 21 22 23 24 25 26 27 28 29 30 31 32 32 34 35 36 37 38 39 40 STATE/TERRITORY MARKETVISITATION % MARKET VISITATION VISITATION SHARE 000 CHANGE SHARE 000 New York 26.04% 10,518 -2.7% 27.09% 10,804 Florida 23.79% 9,610 2.5% 23.51% 9,377 California 19.93% 8,050 -5.6% 21.39% 8,531 Hawaiian Islands 8.16% 3,296 3.6% 7.98% 3.183 Nevada 7.57% 3,058 -5.7% 8.13% 3,243 Guam 4.56% 1,842 14.0% 4.05% 1,615 Massachusetts 4.32% 1,745 -4.9% 4.60% 1,835 Texas 4.32% 1,745 -10.0% 4.86% 1,938 Illinois 3.85% 1,555 -4.0% 4.06% 1,619 Arizona 2.96% 1,196 2.3% 2.93% 1,169 New Jersey 2.87% 1,159 4.5% 2.78% 1,109 Pennsylvania 2.61% 1,054 4.0% 2.54% 1,013 Washington 2.29% 925 16.0% 2.00% 798 Georgia 2.15% 868 3.6% 2.10% 838 Utah 1.83% 739 2.9% 1.80% 718 Virginia 1.31% 529 7.0% 1.24% 495) Colorado 1.26% 509 -7.5% 1.38% 550 Louisiana 1.24% 501 0.5% 1.25% 499) North Carolina 1.12% 452 -17.3% 1.37% 546 Ohio 1.11% 448 6.0% 1.06% 423 Michigan 1.06% 4281 -13.5% 1.24% 495 Maryland 1.01% 408 31.2% 0.78% 311 Tennessee 0.92% 372 -4.8% 0.98% 391 Connecticut 0.80% 323 10.9% 0.73% 291 Oregon 0.80% 323 5.2% 0.77% 307 Minnesota 0.71% 287 1.4% 0.71% 283 South Carolina 0.61% 246 6.3% 0.58% 231 Wyoming 0.61% 246 23.4% 0.50% 199 Wisconsin 0.58% 234 -3.8% 0.61% 243 Indiana 0.56% 226 11.1% 0.51% 203 Missouri 0.42% 170 -21.1% 0.54% New Mexico 0.38% 153 16.2% 0.33% 132 Maine 0.37% 149) 3.8% 0.36% 144 Alabama 0.35% 141 -9.4% 0.39% 156 Rhode Island 0.28% 113 -19.0% 0.35% 140 Alaska 0.27% 109 -19.6% 0.34% 136 lowa 0.26% 105 19.7% 0.22% 88 New Hampshire 0.26% 105 -32.5% 0.39% 156 Oklahoma 0.25% 101 -2.6% 0.26% 104 Kentucky 0.24% 97 -9.9% 0.27% 215 41 42 43 44 45 46 47 48 108 49 50 51 52 * Excludes Canada and Mexico. States with 100 or more respondents are reportedStep by Step Solution
There are 3 Steps involved in it
Step: 1
Get Instant Access to Expert-Tailored Solutions
See step-by-step solutions with expert insights and AI powered tools for academic success
Step: 2
Step: 3
Ace Your Homework with AI
Get the answers you need in no time with our AI-driven, step-by-step assistance
Get Started