Answered step by step
Verified Expert Solution
Question
1 Approved Answer
Complete the grids below to report 5x5 Grids of NPV vs input variable changes noted. SV+20% 360 ATSV+20% NPV Analysis Grid: NPV vs Discount Rate
Complete the grids below to report 5x5 Grids of NPV vs input variable changes noted.
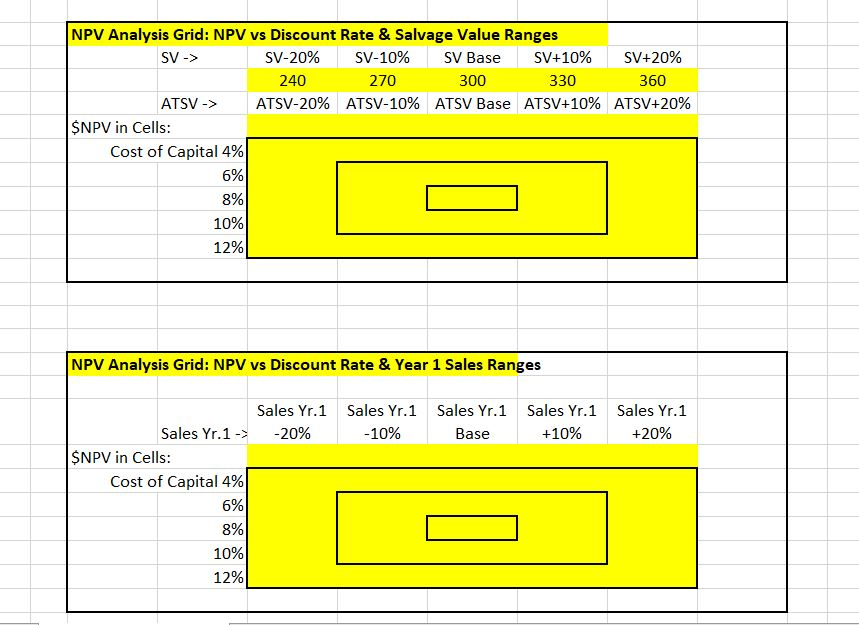
SV+20% 360 ATSV+20% NPV Analysis Grid: NPV vs Discount Rate & Salvage Value Ranges SV -> SV-20% SV-10% SV Base SV+10% 240 270 300 330 ATSV -> ATSV-20% ATSV-10% ATSV Base ATSV+10% $NPV in Cells: Cost of Capital 4% 6% 8% 10% 12% NPV Analysis Grid: NPV vs Discount Rate & Year 1 Sales Ranges Sales Yr.1 -20% Sales Yr.1 -10% Sales Yr.1 Base Sales Yr.1 +10% Sales Yr.1 +20% Sales Yr.1- $NPV in Cells: Cost of Capital 4% 6% 8% 10% 12% SV+20% 360 ATSV+20% NPV Analysis Grid: NPV vs Discount Rate & Salvage Value Ranges SV -> SV-20% SV-10% SV Base SV+10% 240 270 300 330 ATSV -> ATSV-20% ATSV-10% ATSV Base ATSV+10% $NPV in Cells: Cost of Capital 4% 6% 8% 10% 12% NPV Analysis Grid: NPV vs Discount Rate & Year 1 Sales Ranges Sales Yr.1 -20% Sales Yr.1 -10% Sales Yr.1 Base Sales Yr.1 +10% Sales Yr.1 +20% Sales Yr.1- $NPV in Cells: Cost of Capital 4% 6% 8% 10% 12%Step by Step Solution
There are 3 Steps involved in it
Step: 1
Get Instant Access to Expert-Tailored Solutions
See step-by-step solutions with expert insights and AI powered tools for academic success
Step: 2
Step: 3
Ace Your Homework with AI
Get the answers you need in no time with our AI-driven, step-by-step assistance
Get Started