Question
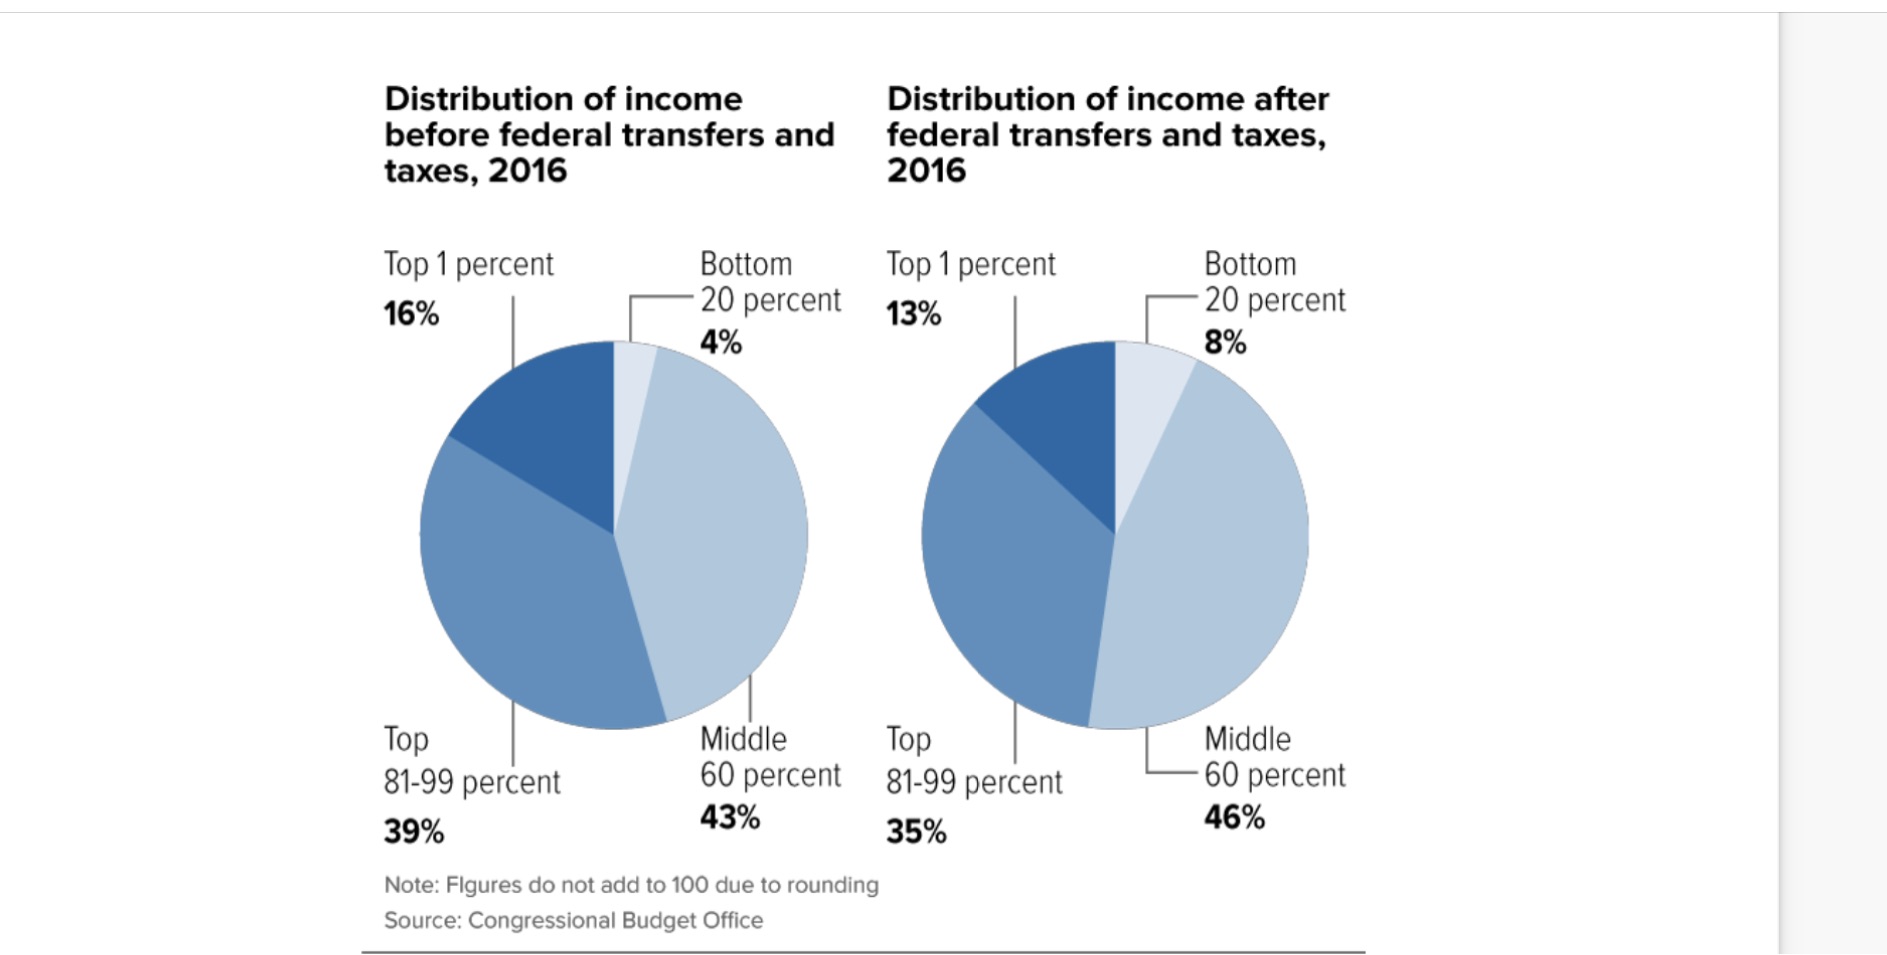
Complete the Plot Lorenz curves and calculate a Gini coefficient for US income pre and post tax and transfers on the same diagram. Distribution of
Complete the Plot Lorenz curves and calculate a Gini coefficient for US income pre and post tax and transfers on the same diagram.

Distribution of income before federal transfers and taxes, 2016 Top 1 percent 16% Top 81-99 percent 39% Bottom 20 percent 4% Middle 60 percent 43% Note: Figures do not add to 100 due to rounding Source: Congressional Budget Office Distribution of income after federal transfers and taxes, 2016 Top 1 percent 13% Top 81-99 percent 35% Bottom -20 percent 8% Middle -60 percent 46%
Step by Step Solution
3.43 Rating (156 Votes )
There are 3 Steps involved in it
Step: 1
To plot Lorenz curves and calculate the Gini coefficient for US income pre and posttax and transfers ...
Get Instant Access to Expert-Tailored Solutions
See step-by-step solutions with expert insights and AI powered tools for academic success
Step: 2

Step: 3

Ace Your Homework with AI
Get the answers you need in no time with our AI-driven, step-by-step assistance
Get StartedRecommended Textbook for
Development Economics
Authors: Debraj Ray
1st Edition
0691017069, 9780691017068
Students also viewed these Economics questions
Question
Answered: 1 week ago
Question
Answered: 1 week ago
Question
Answered: 1 week ago
Question
Answered: 1 week ago
Question
Answered: 1 week ago
Question
Answered: 1 week ago
Question
Answered: 1 week ago
Question
Answered: 1 week ago
Question
Answered: 1 week ago
Question
Answered: 1 week ago
Question
Answered: 1 week ago
Question
Answered: 1 week ago
Question
Answered: 1 week ago
Question
Answered: 1 week ago
Question
Answered: 1 week ago
Question
Answered: 1 week ago
Question
Answered: 1 week ago
Question
Answered: 1 week ago
Question
Answered: 1 week ago
Question
Answered: 1 week ago
Question
Answered: 1 week ago
Question
Answered: 1 week ago
Question
Answered: 1 week ago
View Answer in SolutionInn App


