

Question
Complete the problems below from the textbook. You will need to use the Baseball 2016 Data, Lincolnville School District Bus Data, and the Century National
Complete the problems below from the textbook. You will need to use the "Baseball 2016 Data," "Lincolnville School District Bus Data," and the "Century National Bank Data" files for this assignment.The files are located in the topic materials.
1.Chapter 13 - Problem 63
2.Chapter 13 - Problem 64
3.Chapter 14 - Problem 35
4.Chapter 14 Case A - Century National Bank
For problems requiring computations, please ensure that your Excel file includes the associated cell computations and/or statistics output. This information is needed in order to receive full credit on these problems.
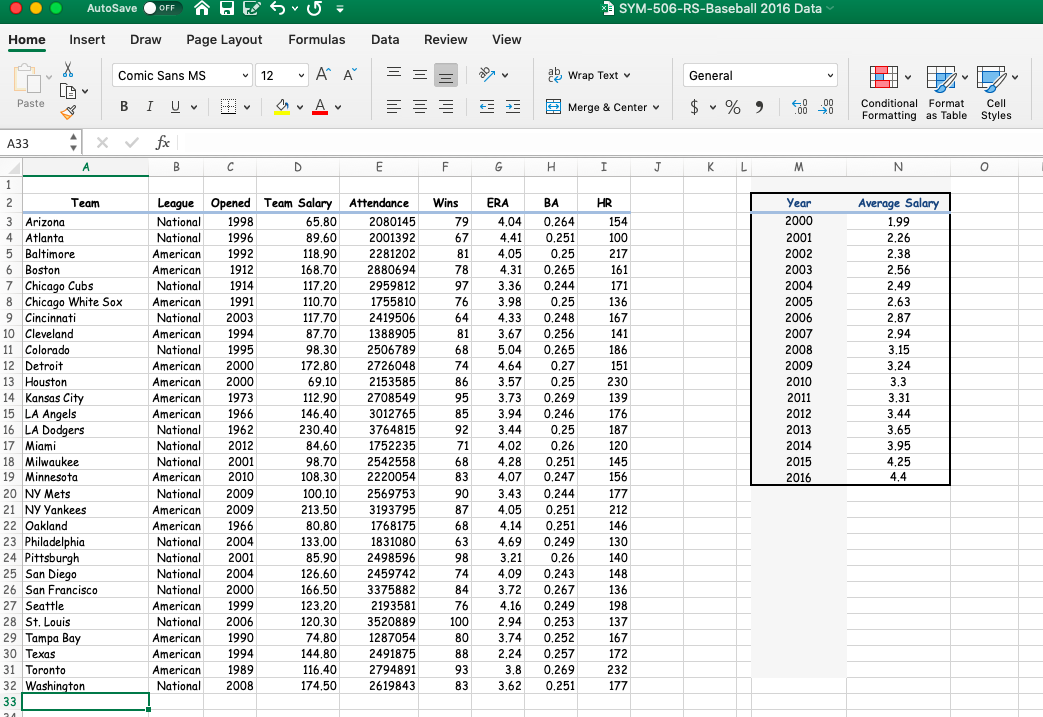
63.Refer to the Baseball 2016 data, which reports information on the 2016 Major League
Baseball season. Let attendance be the dependent variable and total team salary, in
millions of dollars be the independent variable. Determine the regression equation and
answer the following questions.
a)Draw a scatter diagram. From the diagram, does there seem to be a direct relationship
between the two variables?
b)What is the expected attendance for a team with a salary of $100.0 million?
c)If the owners pay an additional $30 million, how many more people could they expect to
attend?
d)At the .05 significance level, can we conclude that the slope of the regression line is
positive? Conduct the appropriate test of hypothesis.
e)What percentage of the variation in attendance is accounted for by salary?
f)Determine the correlation between attendance and team batting average and between
attendance and team ERA. Which is stronger? Conduct an appropriate test of hypothesis
for each set of variables.
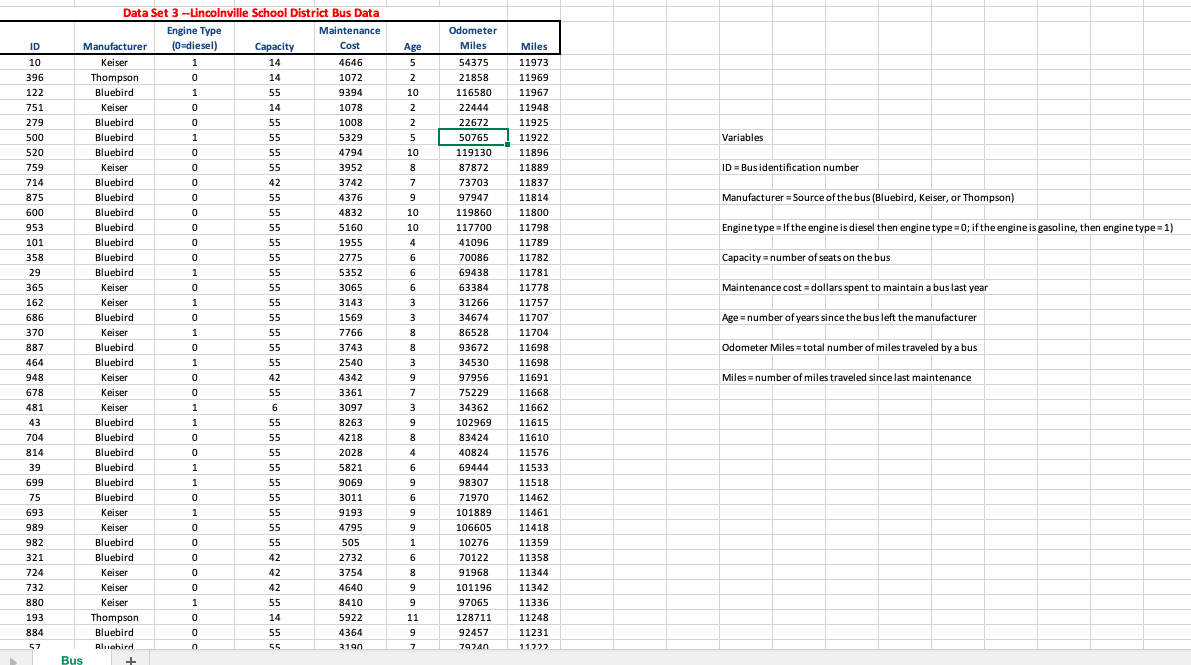
64.Refer to the Lincolnville School bus data. Develop a regression equation that expresses the relationship between age of the bus and maintenance. The age of the bus is the independent
variable.
a)Draw a scatter diagram. What does this diagram suggest as to the relationship between
the two variables? Is it direct or indirect? Does it appear to be strong or weak?
b)Develop a regression equation. How much does an additional year add to the maintenance
cost. What is the estimated maintenance cost for a 10-year-old bus?
c)Conduct a test of hypothesis to determine whether the slope of the regression line is
greater than zero. Use the .05 significance level. Interpret your findings from parts (a),
(b), and (c) in a brief report.
35.Refer to the Lincolnville School District bus data. First, add a variable to change the type of engine (diesel or gasoline) to a qualitative variable. If the engine type is diesel, then set the qualitative variable to 0. If the bus type is gasoline, then set the qualitative variable to 1. Develop a
regression equation using statistical software with maintenance as the dependent variable
and age, odometer miles, miles since last maintenance and engine type the independent variables.
a)Develop a correlation matrix. Which independent variables have strong or weak correlations
with the dependent variable? Do you see any problems with multicollinearity?
b)Use a statistical software package to determine the multiple regression equation. How did you select the variables to include in the equation? How did you use the information from the correlation analysis? Show that your regression equation shows a significant relationship. Write out the regression equation and interpret its practical application. Report and interpret the R-square.
c)Develop a histogram or a stem-and-leaf display of the residuals from the final regression
equation developed in part (f). Is it reasonable to conclude that the normality assumption
has been met?
d)Plot the residuals against the fitted values from the final regression equation developed
in part (f) against the fitted values ofY.Plot the residuals on the vertical axis and the fitted
values on the horizontal axis.
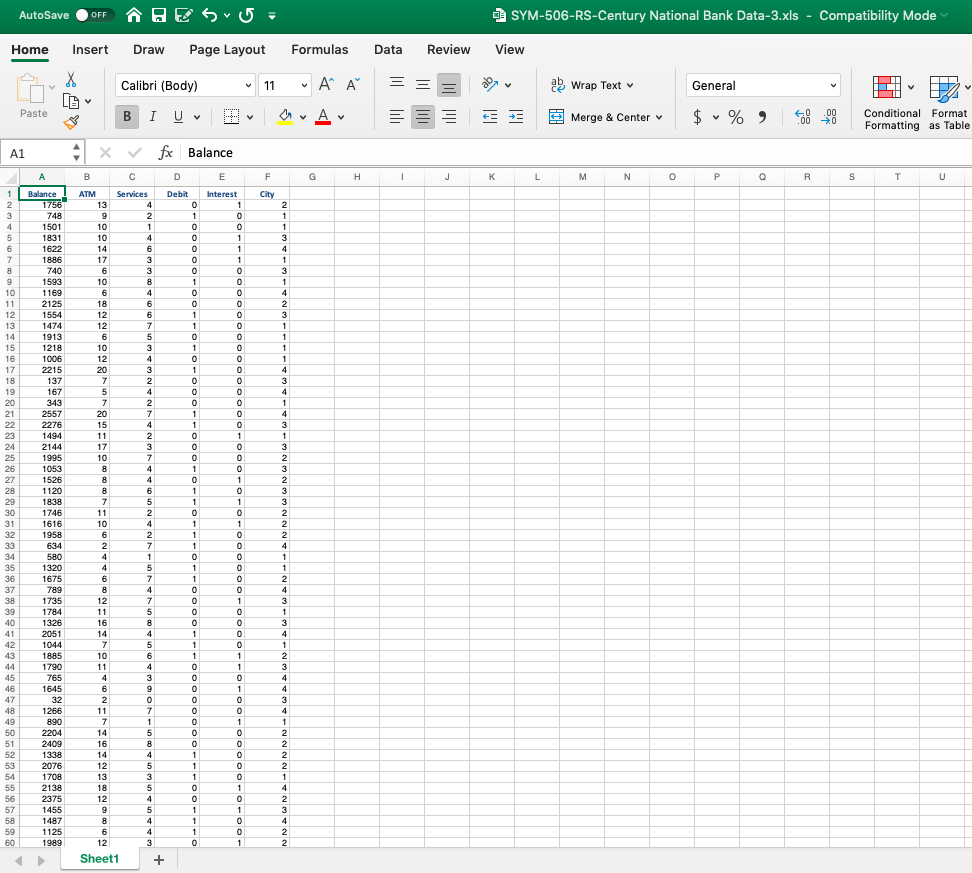
A. The Century National Bank
Refer to the Century National Bank data. Using checking
account balance as the dependent variable and using as
independent variables the number of ATM transactions, the
number of other services used, whether the individual has a
debit card, and whether interest is paid on the particular account,
write report indicating which of the variables seem
related to the account balance and how well they explain
the variation in account balances. Should all of the independent
variables proposed be used in the analysis or can
some be dropped.
Step by Step Solution
There are 3 Steps involved in it
Step: 1

Get Instant Access to Expert-Tailored Solutions
See step-by-step solutions with expert insights and AI powered tools for academic success
Step: 2

Step: 3
Ace Your Homework with AI
Get the answers you need in no time with our AI-driven, step-by-step assistance
Get Started
Fundamentals Of Business Mathematics In Canada
Authors: F. Ernest Jerome, Jackie Shemko
3rd Edition
1259370151, 978-1259370151