

Question
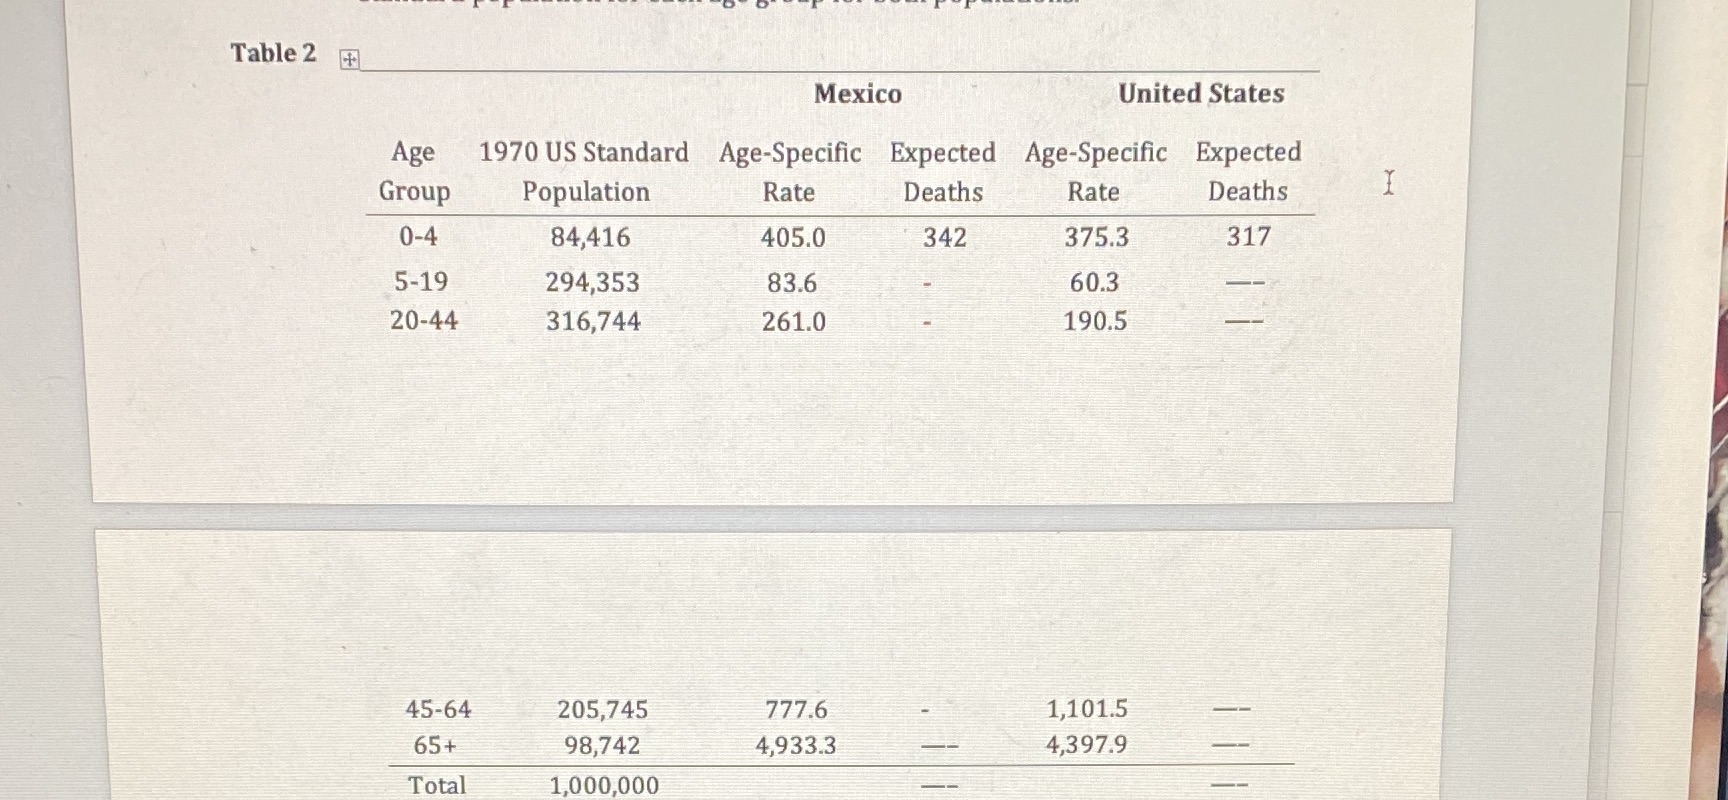
Complete the table below by computing the expected number of deaths in the standard population for each age group for both populations. Calculate the age
Complete the table below by computing the expected number of deaths in the standard population for each age group for both populations. Calculate the age adjusted rates for the two populations.Please help I am struggling to understand
Step by Step Solution
There are 3 Steps involved in it
Step: 1

Get Instant Access to Expert-Tailored Solutions
See step-by-step solutions with expert insights and AI powered tools for academic success
Step: 2

Step: 3
Ace Your Homework with AI
Get the answers you need in no time with our AI-driven, step-by-step assistance
Get Started
Intermediate Algebra
Authors: Marvin L Bittinger
11th Edition
0321968395, 9780321968395