

Answered step by step
Verified Expert Solution
Question
1 Approved Answer
Complete the table with the data given Table 6. Calculations for pooled class tree data. (NOTE: # of plots is the number of plots where
Complete the table with the data given
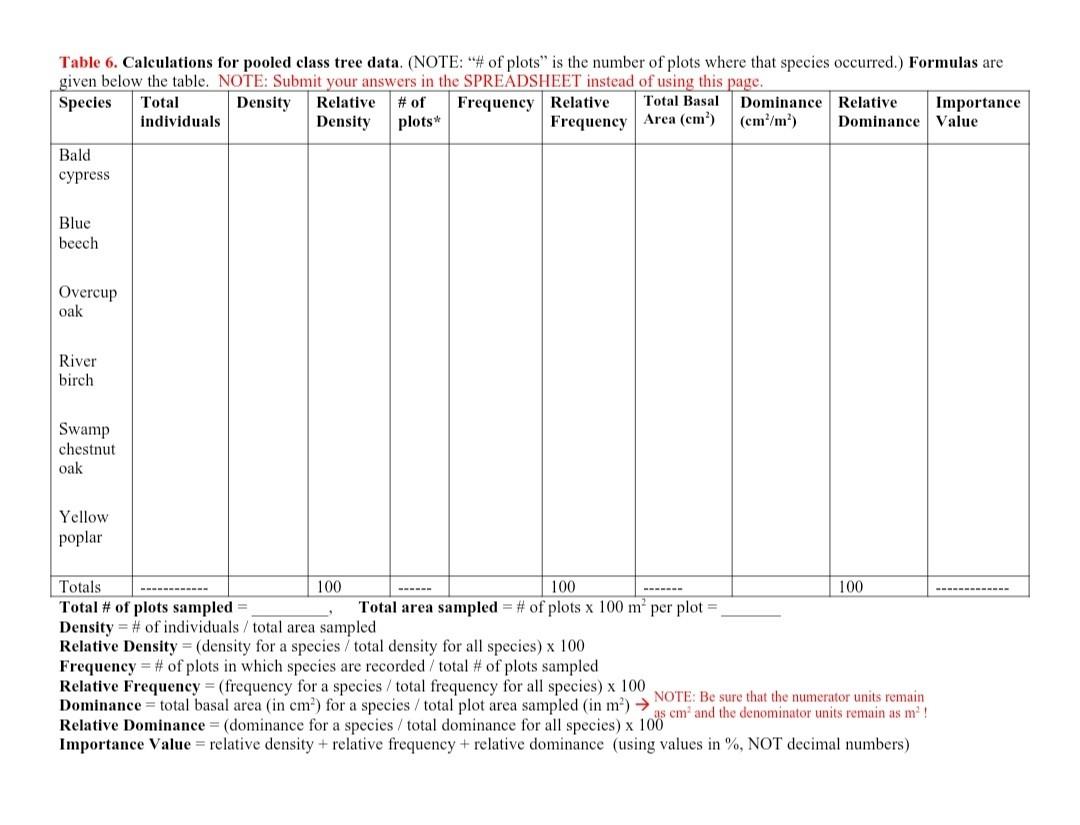
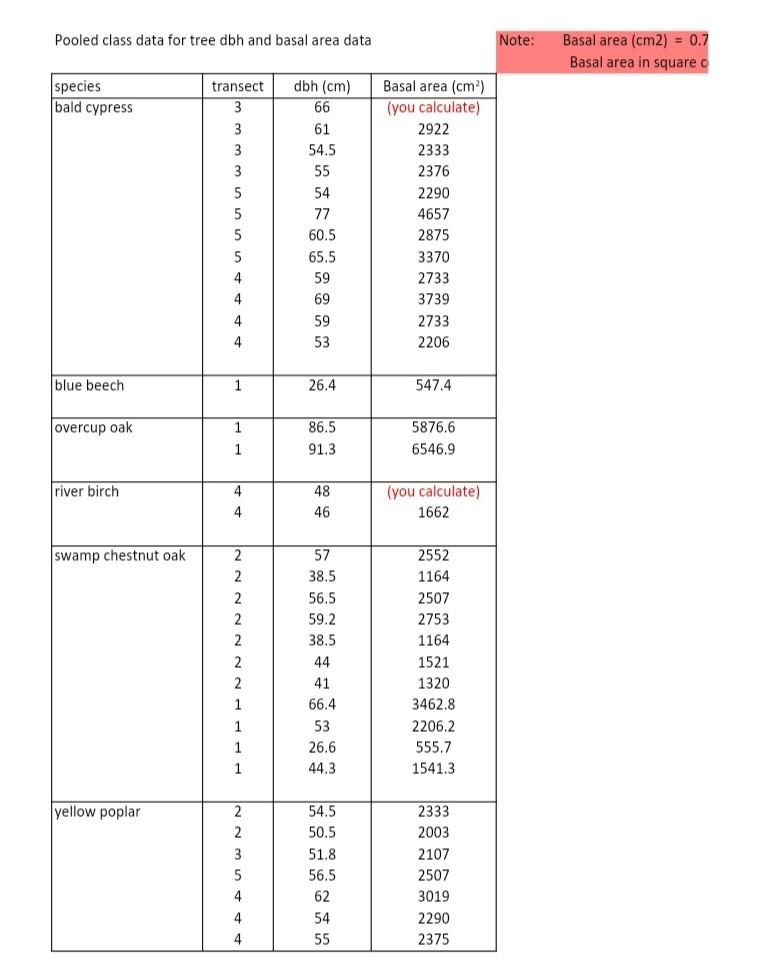
Table 6. Calculations for pooled class tree data. (NOTE: "# of plots" is the number of plots where that species occurred.) Formulas are given below the table. NOTE: Submit your answers in the SPREADSHEET instead of using this page. Species Total Density Relative # of Frequency Relative Total Basal Dominance Relative Importance individuals Density plots* Frequency Area (cm) (cm /m) Dominance Value Bald cypress Blue beech Overcup oak River birch Swamp chestnut oak Yellow poplar Totals 100 100 100 Total # of plots sampled = Total area sampled = # of plots x 100 m per plot = Density = # of individuals / total area sampled Relative Density = (density for a species / total density for all species) x 100 Frequency = # of plots in which species are recorded / total # of plots sampled Relative Frequency = (frequency for a species / total frequency for all species) x 100 Dominance = total basal area (in cm) for a species / total plot area sampled (in m) NOTE: Be sure that the numerator units remain as em and the denominator units remain as m?! Relative Dominance = (dominance for a species / total dominance for all species) x 100 Importance Value = relative density + relative frequency + relative dominance (using values in %, NOT decimal numbers) Pooled class data for tree dbh and basal area data Note: Basal area (cm2) = 0.7 Basal area in square o species bald cypress transect 3 3 3 3 5 5 5 dbh (cm) 66 61 54.5 55 54 77 60.5 65.5 59 69 59 53 Basal area (cm) (you calculate) 2922 2333 2376 2290 4657 2875 3370 2733 3739 2733 2206 5 4 4 4 4 blue beech 1 26.4 547.4 overcup oak 1 86.5 91.3 5876.6 6546.9 1 river birch 4 48 46 (you calculate) 1662 4 swamp chestnut oak 2 2 2 2 2 2 2 57 38.5 56.5 59.2 38.5 44 41 66.4 53 26.6 44.3 2552 1164 2507 2753 1164 1521 1320 3462.8 2206.2 555.7 1541.3 1 1 1 1 yellow poplar 2 2 3 5 4 54.5 50.5 51.8 56.5 62 54 55 2333 2003 2107 2507 3019 2290 2375 4 4 Table 6. Calculations for pooled class tree data. (NOTE: "# of plots" is the number of plots where that species occurred.) Formulas are given below the table. NOTE: Submit your answers in the SPREADSHEET instead of using this page. Species Total Density Relative # of Frequency Relative Total Basal Dominance Relative Importance individuals Density plots* Frequency Area (cm) (cm /m) Dominance Value Bald cypress Blue beech Overcup oak River birch Swamp chestnut oak Yellow poplar Totals 100 100 100 Total # of plots sampled = Total area sampled = # of plots x 100 m per plot = Density = # of individuals / total area sampled Relative Density = (density for a species / total density for all species) x 100 Frequency = # of plots in which species are recorded / total # of plots sampled Relative Frequency = (frequency for a species / total frequency for all species) x 100 Dominance = total basal area (in cm) for a species / total plot area sampled (in m) NOTE: Be sure that the numerator units remain as em and the denominator units remain as m?! Relative Dominance = (dominance for a species / total dominance for all species) x 100 Importance Value = relative density + relative frequency + relative dominance (using values in %, NOT decimal numbers) Pooled class data for tree dbh and basal area data Note: Basal area (cm2) = 0.7 Basal area in square o species bald cypress transect 3 3 3 3 5 5 5 dbh (cm) 66 61 54.5 55 54 77 60.5 65.5 59 69 59 53 Basal area (cm) (you calculate) 2922 2333 2376 2290 4657 2875 3370 2733 3739 2733 2206 5 4 4 4 4 blue beech 1 26.4 547.4 overcup oak 1 86.5 91.3 5876.6 6546.9 1 river birch 4 48 46 (you calculate) 1662 4 swamp chestnut oak 2 2 2 2 2 2 2 57 38.5 56.5 59.2 38.5 44 41 66.4 53 26.6 44.3 2552 1164 2507 2753 1164 1521 1320 3462.8 2206.2 555.7 1541.3 1 1 1 1 yellow poplar 2 2 3 5 4 54.5 50.5 51.8 56.5 62 54 55 2333 2003 2107 2507 3019 2290 2375 4 4Step by Step Solution
There are 3 Steps involved in it
Step: 1

Get Instant Access to Expert-Tailored Solutions
See step-by-step solutions with expert insights and AI powered tools for academic success
Step: 2

Step: 3
Ace Your Homework with AI
Get the answers you need in no time with our AI-driven, step-by-step assistance
Get Started
Acct 2302 Managerial Accounting
Authors: Fred Phillips Stacey Whitecotton, Robert Libby
1st Edition
1259135624, 978-1259135620