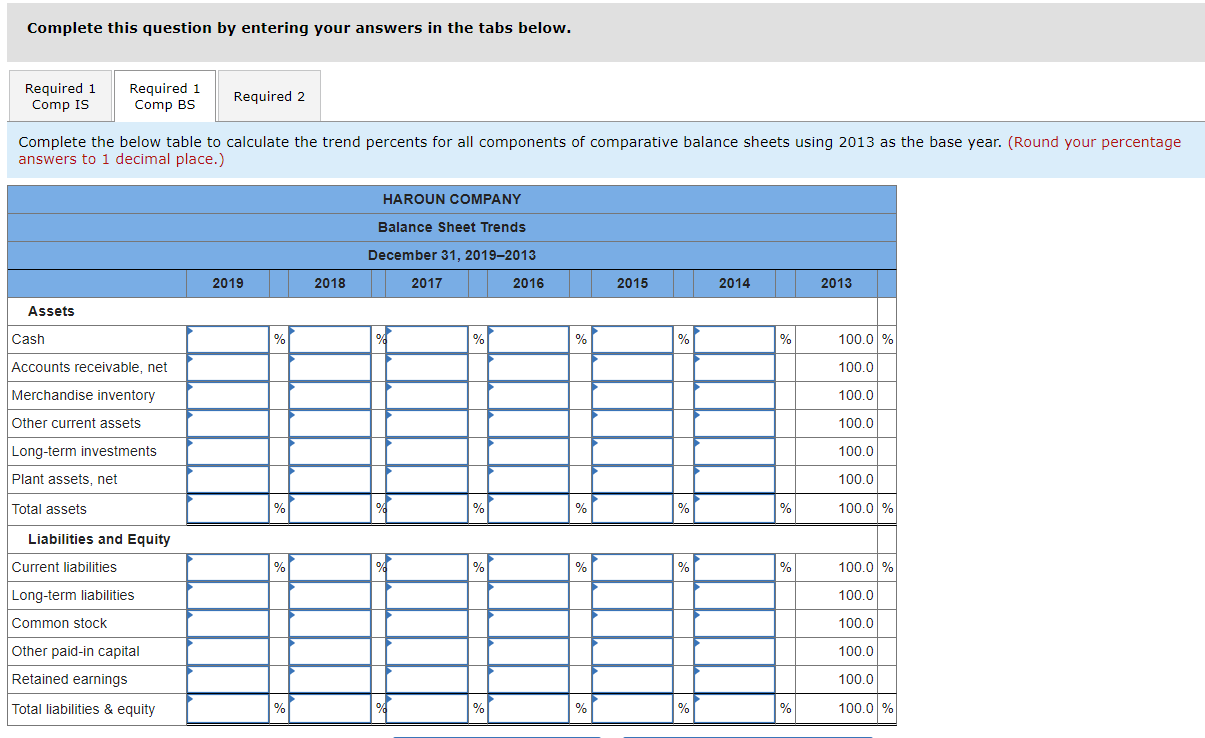
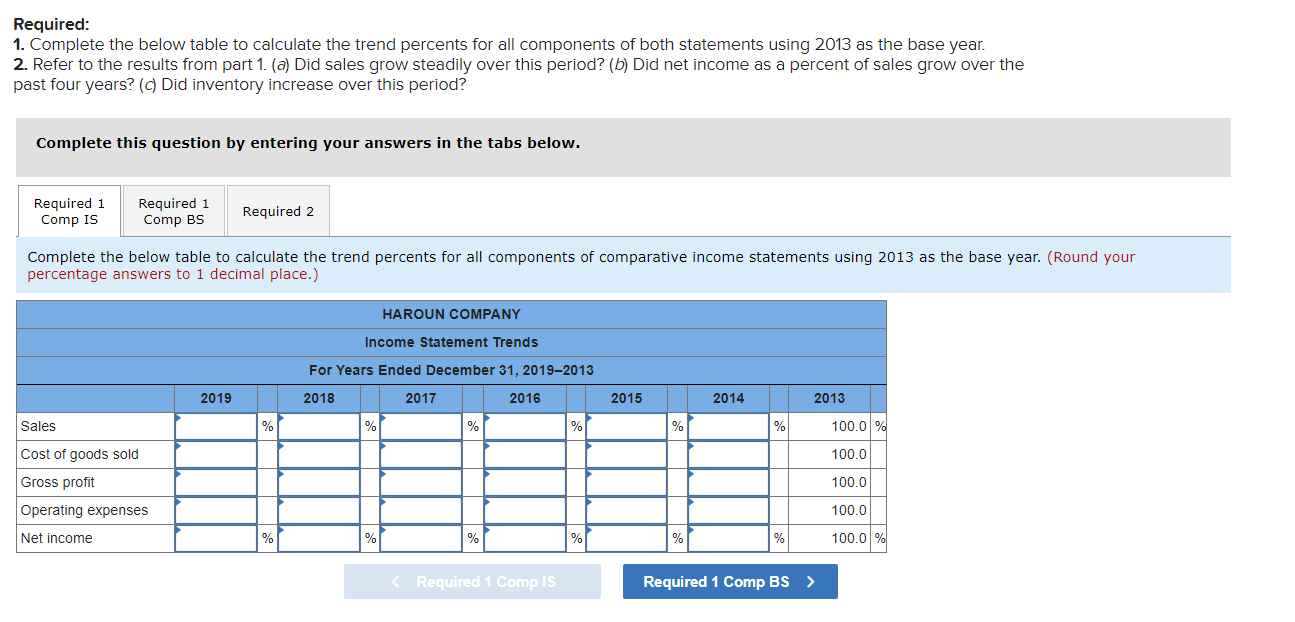
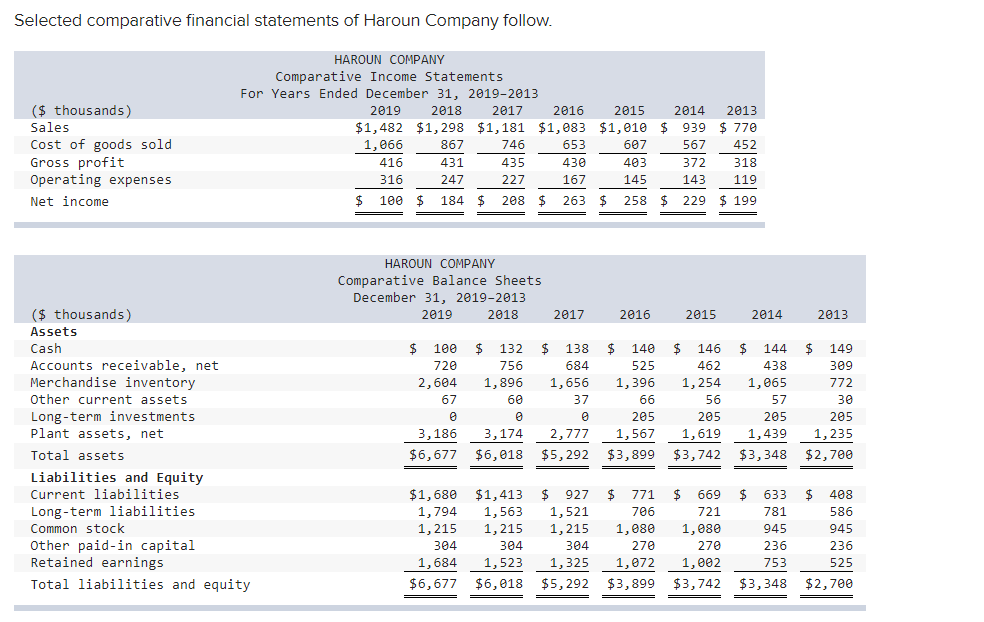
Complete this question by entering your answers in the tabs below. Required 1 Comp IS Required 1 Comp BS Required 2 Complete the below table to calculate the trend percents for all components of comparative balance sheets using 2013 as the base year. (Round your percentage answers to 1 decimal place.) HAROUN COMPANY Balance Sheet Trends December 31, 2019-2013 2019 2018 2017 2016 2015 2014 2013 Assets Cash % % % 100.0 % Accounts receivable, net 100.0 Merchandise inventory 100.0 Other current assets 100.0 Long-term investments 100.0 Plant assets, net 100.0 Total assets % 100.0 % Liabilities and Equity Current liabilities % % 100.0 % Long-term liabilities 100.0 Common stock 100.0 100.0 Other paid-in capital Retained earnings 100.0 Total liabilities & equity 100.0 % Required: 1. Complete the below table to calculate the trend percents for all components of both statements using 2013 as the base year. 2. Refer to the results from part 1. (a) Did sales grow steadily over this period? (b) Did net income as a percent of sales grow over the past four years? (Did inventory increase over this period? Complete this question by entering your answers in the tabs below. Required 1 Comp IS Required 1 Comp BS Required 2 Complete the below table to calculate the trend percents for all components of comparative income statements using 2013 as the base year. (Round your percentage answers to 1 decimal place.) HAROUN COMPANY Income Statement Trends For Years Ended December 31, 2019-2013 2019 2018 2017 2016 2015 2014 2013 Sales % % % % % % 100.0 % Cost of goods sold 100.0 100.0 Gross profit Operating expenses 100.0 Net income % % % % % % 100.0 % Selected comparative financial statements of Haroun Company follow. ($ thousands) Sales Cost of goods sold Gross profit Operating expenses Net income HAROUN COMPANY Comparative Income Statements For Years Ended December 31, 2019-2013 2019 2018 2017 2016 2015 2014 2013 $1,482 $1,298 $1,181 $1,083 $1,010 $ 939 $ 770 1,066 867 746 653 607 567 452 416 431 435 430 403 372 318 316 247 227 167 145 143 119 $ 100 $ 184 $ $ 208 $ 263 $ 258 $ 229 $ 199 HAROUN COMPANY Comparative Balance Sheets December 31, 2019-2013 2019 2018 2017 2016 2015 2014 2013 ($ thousands) Assets Cash Accounts receivable, net Merchandise inventory Other current assets Long-term investments Plant assets, net Total assets Liabilities and Equity Current liabilities Long-term liabilities Common stock Other paid-in capital Retained earnings Total liabilities and equity $ 100 $ 132 $ $ 138 $ 140 $ 146 $ 144 $ 149 720 756 684 525 462 438 309 2,604 1,896 1,656 1,396 1,254 1,065 772 67 60 37 66 56 57 30 0 0 0 205 205 205 205 3,186 3, 174 2,777 1,567 1,619 1,439 1,235 $6,677 $6,018 $5,292 $3,899 $3,742 $3,348 $2,700 $1,680 $1,413 $ $ 927 $ 771 1,794 1,563 1,521 706 1,215 1, 215 1,215 1,080 304 304 304 270 1,684 1,523 1,325 1,072 $6,677 $6,018 $5,292 $3,899 $ 669 $ 633 721 781 1,080 945 270 236 1,002 753 $3,742 $3,348 $ 408 586 945 236 525 $2,700