Completely explain the the following code and give a detailed review of each line of code
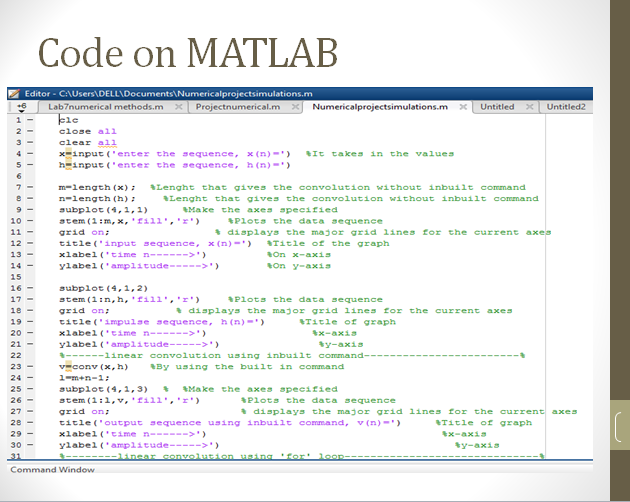
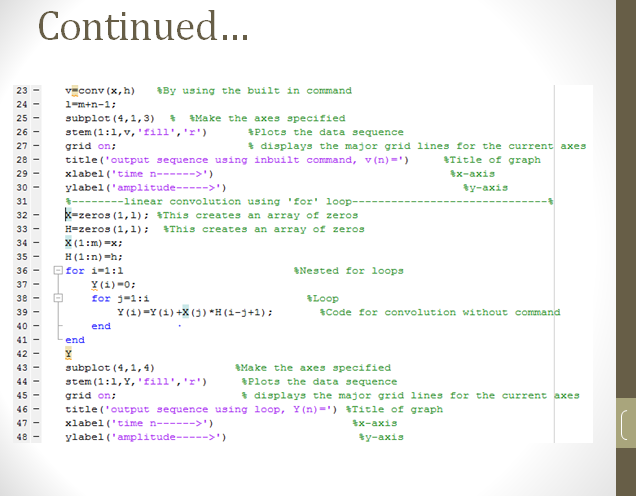
Code on MATLAB Untitled X Untitled2 UN Editor-CAUsers\DELL\Documents\Numericalprojectsimulations.m Lab7numerical methods.mx Projectnumerical.m Numericalprojectsimulations.mx Jele close all clear 011 x=input('enter the sequence, (n)-') It takes in the values h=input('enter the sequence, h(n) =) m-length(x): Lenght that gives the convolution without inbuilt command n-length (h): Lenght that gives the convolution without inbuilt command subplot (4,1,1) Make the axes specified 10 stem (1:m, x, fill','') Plots the data sequence 11 grid on displays the major grid lines for the current axes 12 title('input sequence, x(n)-) Title of the graph 13 xlabel('time n------>> on x-axis ylabel('amplitude----->> tony-axia 15 16 subplot (4,1,2) 17 stem (1:n, h, 'fill', 'I') Plots the data sequence grid on displays the major grid lines for the current axes title('impulse sequence, h(n)-) Title of graph 20 xlabel(' time n------>') tx-axia 21 ylabel (amplitude ----->> ty-axis 22 ------linear convolution using inbuilt command- 23 econy (xh) By using the built in command 24 1-m+n-1; 25 subplot (4,1, 3) & Make the axes specified 26 stem (1:1,v,'fill', 'r') Plots the data sequence 27 grid on displays the major grid lines for the current axes title('output sequence using inbuilt command, vin)-) Title of graph 29 xlabel('time n------>> tx-axis 30 ylabel (amplitude-->) ty-axia -----Ar convolution using for leon- Command Window Continued... - 23 24 25 26 27 - 28 29 - 30 - 31 32 - 33 - 34 - 35 - vconv (x, h) #By using the built in command 1-m+n-1; subplot (4,1,3) $ *Make the axes specified stem (1:1,v,'fill', 'r') *Plots the data sequence grid on * displays the major grid lines for the current axes title('output sequence using inbuilt command, v(n)=') Title of graph xlabel('time n------>') tx-axis ylabel('amplitude-----> ty-axis --------linear convolution using for loop-- kazeros (1,1); This creates an array of zeros H=zeros (1,1) This creates an array of zeros X(1:m)=x; H(1:n)-h; for i=1:1 *Nested for loops Y(1)-0; for j=1:1 Loop Y(1)=Y(1) +X(3) *H (1-3+1); *Code for convolution without command end end Y subplot (4,1,4) Make the axes specified stem (1:1,Y,'1111','*') Plots the data sequence grid on; displays the major grid lines for the current axes title('output sequence using loop, Y(n) =') Title of graph xlabel('time ------>') $x-axis ylabel('amplitude ----->> fy-axis 36 - 37 38 - 39 - 40 41 42 43 - 45 - 46 - 47 - 48 - Code on MATLAB Untitled X Untitled2 UN Editor-CAUsers\DELL\Documents\Numericalprojectsimulations.m Lab7numerical methods.mx Projectnumerical.m Numericalprojectsimulations.mx Jele close all clear 011 x=input('enter the sequence, (n)-') It takes in the values h=input('enter the sequence, h(n) =) m-length(x): Lenght that gives the convolution without inbuilt command n-length (h): Lenght that gives the convolution without inbuilt command subplot (4,1,1) Make the axes specified 10 stem (1:m, x, fill','') Plots the data sequence 11 grid on displays the major grid lines for the current axes 12 title('input sequence, x(n)-) Title of the graph 13 xlabel('time n------>> on x-axis ylabel('amplitude----->> tony-axia 15 16 subplot (4,1,2) 17 stem (1:n, h, 'fill', 'I') Plots the data sequence grid on displays the major grid lines for the current axes title('impulse sequence, h(n)-) Title of graph 20 xlabel(' time n------>') tx-axia 21 ylabel (amplitude ----->> ty-axis 22 ------linear convolution using inbuilt command- 23 econy (xh) By using the built in command 24 1-m+n-1; 25 subplot (4,1, 3) & Make the axes specified 26 stem (1:1,v,'fill', 'r') Plots the data sequence 27 grid on displays the major grid lines for the current axes title('output sequence using inbuilt command, vin)-) Title of graph 29 xlabel('time n------>> tx-axis 30 ylabel (amplitude-->) ty-axia -----Ar convolution using for leon- Command Window Continued... - 23 24 25 26 27 - 28 29 - 30 - 31 32 - 33 - 34 - 35 - vconv (x, h) #By using the built in command 1-m+n-1; subplot (4,1,3) $ *Make the axes specified stem (1:1,v,'fill', 'r') *Plots the data sequence grid on * displays the major grid lines for the current axes title('output sequence using inbuilt command, v(n)=') Title of graph xlabel('time n------>') tx-axis ylabel('amplitude-----> ty-axis --------linear convolution using for loop-- kazeros (1,1); This creates an array of zeros H=zeros (1,1) This creates an array of zeros X(1:m)=x; H(1:n)-h; for i=1:1 *Nested for loops Y(1)-0; for j=1:1 Loop Y(1)=Y(1) +X(3) *H (1-3+1); *Code for convolution without command end end Y subplot (4,1,4) Make the axes specified stem (1:1,Y,'1111','*') Plots the data sequence grid on; displays the major grid lines for the current axes title('output sequence using loop, Y(n) =') Title of graph xlabel('time ------>') $x-axis ylabel('amplitude ----->> fy-axis 36 - 37 38 - 39 - 40 41 42 43 - 45 - 46 - 47 - 48