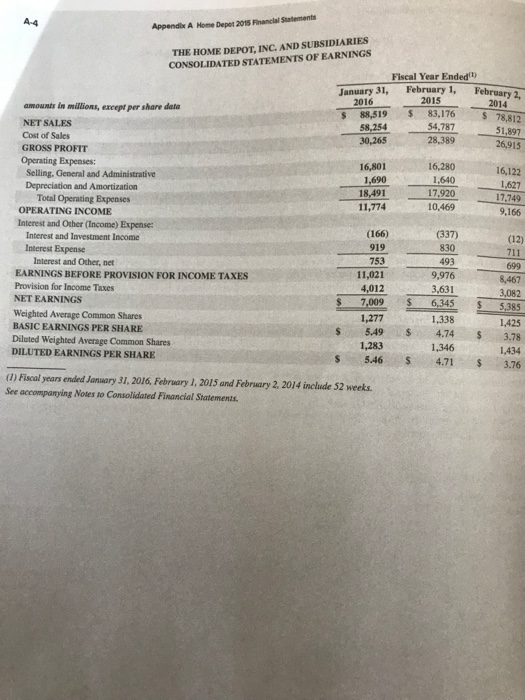
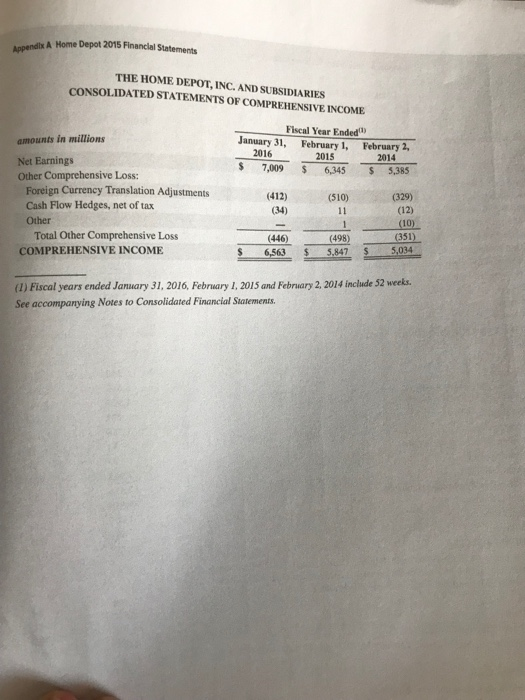
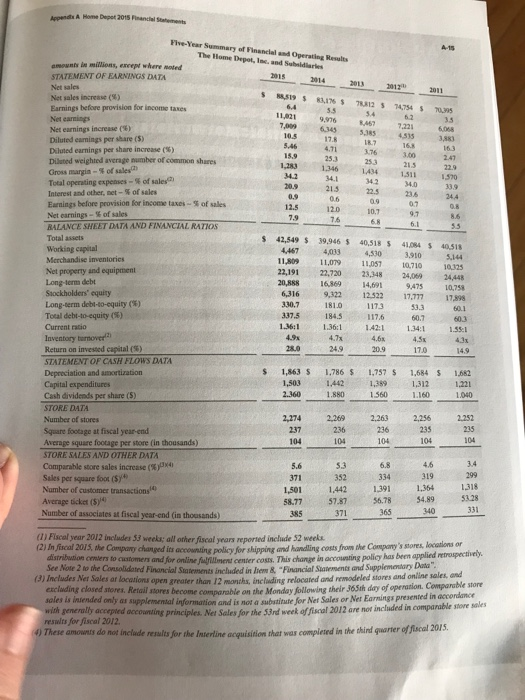
COMPREHENSIVE PROBLEM ea0 ANALYSIS OF THE FINANCIAL STATEMENTS OF A PUBLICI OWNED CORPORATION ome Depot, Inc. This Comprehensive Problem is to acquaint you with the content of the 201S finaial satements are for the fiscal year ended January 31, 2016.) The problem contains three parts, which are independent of one another. Part I is designed to familiarize you w greseral cetents of a company's financial statements; Part Il involves analysis of them with the pany's liqaidity, and Par IIl analyzes the trend in its profitability. U' you work this problem ar a growp assignment, cach group member should be p A good sarting point for understanding the financial statements of a company such as Home Depot, Inc, is to understand the accounting policies used in preparing those state- ments. The first nose accompanying the financial statements provides a brief description of the major accounting policies the company used. Most of the areas discussed in this note have been covered in this text. Part Annual reports inclode not only comparative financial satements but also other sources of information, such as: A molilyear summary of financial highlights, a summary of key statistics for the past 5 or 10 years. Several pages of Notes that accompary the financial statements. Reports by management and by the independent auditors in which they express their respective responsibilities for the financial statements Instructions Answer each of the following qpestions and explain where in the statements, notes, or other sections of the annual report you located the information used in your ans a. How many years all of these cerning these statements? are covered in cach of the primary comparative financial statements? Were statements audited? Name the auditors. What were the auditors' conclusions con- b. Home Depot, Inc.,,combines its statement of retained earnings with another financial state- ment. Where are details about changes in the amount of retained earnings found? Over the three years presented, have the company's annual net cash flows been positive or negative from (1) operating activities, (2) investing activities, and (3) financing activities? Has the company's cash balance increased or decreased during each of these three years? c. Part II Assume that you are the credit manager of a medium-size supplier of building mate- rials and related products. Home Depot wants to make credit purchases from your company with payment due in 60 days. a. As general background, read the first note to the financial statements, "Summary of Significant Accounting Policies." Next, compute the following for the fiscal years 2016, and February 1, 2015 (round percentages to the nearest tenth of computations to one decimal place). L. Current ratio. ending January 31, 1 percent, and other 2. Quick ratio 3. Amount of working capital. change in working capital from the prior year Percentause change in cash and cash equivalents from the prior year. On the basis of your analysis i or a, does the company's liquidity appear to have increased of Home Depot to pay for its purchases, do you see any major consider basis of your analysis in part the year b the most recent fiscal year? Ex the ability of Home Otherthot should enter into your company's decision? Explain. essigns each customer one of the four credit ratings listed below. Assign a ou may refer to any of your computations or observations in parts a companyome Depot, Inc., and write a memorandum explaining your decision. ( credit rating to Ho through c, and to any intormation contained in the annual me repor.) POSSIBLE CREDIT RATINGS Litle or no risk of inability to pay. For customers in this category, we ill Outstasonable order without imposing a credit limit. The customer's credit is reevalusted annually R. Good Customer has good debt-paying ability but is assigned a credit limit that is revicwed every 90 days. Orders above the credit limit are accepted only on a cash basis. c. Marginal Customer appears sound, but credit should be extended only on a 30-day basis and with a relatively low credit limit. Creditworthiness and credit limit are reevaluated every 90 days. Unacceptable Customer does not qualify for credit. D. Part III As general background, study the "Five-Year Summary of Financial and Operating Results." Instructions a. Compute the following for the fiscal years ending January 31, 2016, and February 1, 2015 (round percentages to the nearest tenth of I percent): I. Percentage change in net sales (relative to the prior year). 2 Percentage change in net earnings. 3. Gross profit rate. 4. Net income as a percentage of sales. 5. Return on average total assets. 6. Return on average total equity coeclusion(s). te a statement that describes your conclusion(s) concerning trends in Hom e itablity during the period covered in your analysis in part a above. Jusity your coos ApenlsHme Dupa 2015 THE HOME DEPOT, INC. AND SUBSIDIARIES CONSOLIDATED STATEMENTS OF COMPREHENSIVE INCOME Fiscal Year Ended) January 31, February 1, February 2, $ 7,009 6,345 $ 5,385 412)(510) (329) amounts in millions 2016 2014 Net Earnings Other Comprehensive Loss: Foreign Currency Translation Adjustments Cash Flow Hedges, net of tax Other (34) (12) Total Other Comprehensive Loss COMPREHENSIVE INCOME (351 S 6,563 $ 5.847 5,034 446) (498) S 6563 5.847 (1) Fiscal years ended January 31, 2016, February 1, 2015 and February 2, 2014 include 52 weeks. See accompanying Notes to Consolidated Financial Statements Statements Appends A Home Depot 2015 Financ January 31, 2016 February 1, 2015 amounts in miltions, except share and per share date ASSETS Current Assets: s 2,216 1,723 1,484 11,079 1,016 15,302 38,513 15.793 22.720 1,353 1,890 11,809 1,078 16,993 Cash and Cash Equivalents Receivables, net Other Current Assets Total Current Assets Property and Equipment, at cot Less Accumolased Depreciation and Amortization 2,102 Net Property and Equipment Other Assets $ 42,549 39.946 Total Assets LIABILITIES AND STOCKHOLDERS' EQUITY Current Liabilities: 350 290 1,515 1,566 Short-Term Debt Accounts Piyable 1,391 Accrued Salaries and Related Expenses Sales Taxes Payable 1,468 35 38 1,806 11,269 16,869 1,844 642 30,624 Deferred Revenue 34 Income Taxes Payable Crrent Insallinents of Long-Term Detbe 1,943 12,526 Other Accrued Expenses Total Current Liabilities Long-Term Deht, excluding current installmenes Other Long-Term Liabilities Deferred Income Taxes 1,965 Total Liabilities STOCKHOLDERS' EQUITY Common Stock, per value soos: authorized: 10 billion shares; issued: .772 billion shares at January 31, 2016 and 1.768 billion shares at February 1, 2015; outstanding: 1.252 billion shares at Janusry 31, 2016 and 1.307 billion shares at February 1.201s Paid-In Capital Retained Earnings Accumulated Other Comprehensive Loss Treasury Stock, at cost, 520 million shares at January 31, 2016 and 461 million shares at February 1, 2015 9,347 30,973 (898) 8,885 26,995 (452) Total Stockholders' Equity 33,194) (26.194) Total Liablities and Stockholders' Equity 6,316 9,322 S 39,946 See accompanying Notes to Consolidated Financial Statements. Depot 201S Financiel Statements THE HOME DEPOT, INC. AND SUBSIDIARIES CONSOLIDATED STATEMENTS OF STOCKHOLDERS' EQUITY per share data Shares Amount Capital Earnings Income (Loss) Traur tckcko ulanct, February 3, 2013 1,754 $88 S 79485 20,038 Income (Loss) Shares Amoent 9 (270)(10,694) 17,777 5,385 Shares Isued Under Employee Stock Plans 5,385 103 Tas Eifflect of Stock-Based Foerign Curency Translation Adjustments 123 (329) (12) Cash Flow Hedges, net of tax (12) Ssock Options, Awards and Amortization of Restricted Stock 228 228 (8500) (2,243) Repurchases of Common Stock (111) (,300) Cash Dividends (S1.56 per share) (2,243) (10) Balance, February 2, 2014 Net Earnings Shares Issued Under Employee Stock Plans Tax Efect of Stock-Based Compensation Foreign Currency Translation Adjustments Cash Flow Hedges, net of tax Stock Options, Awards and Amortization of Restricted Stock Repurchases of Commion Stock Cash Dividends ($1.88 per share) Other Balance, February 1, 2015 1,761 S 88 $ 8,402 23,180 6,345 46 (38) S 19194) 12,522 122 122 136 7 136 (S10)_ (510) 225 (7,000) (80) (7,000 - (2,530) (452) (46) (26,194) 9,322 7,009 1,768 S 8 S 8,88S s 26995 S 7,009 Earnings Employee Shares Issued Under Employee Stock Plans4 Tax Effect of Stock-Based Compensation Foreign Currency Translation Adjustments Cash Flow Hedges, net of tax Stock Options, Awards and Amortization of Restricted Stock Repurchases of Common Stock Cash Dividends ($2.36 per share) Balance, January 31, 2016 73 73 145 145 34) 244 (412)_ (412) (34)- -244 (59) (7.000) 7,000) (3,031) (898) (520) (33,194)S 6,316 1,772 $ 88 5 9,347 $ 30,973 $ See accompanying Notes to Consolidated Financial Statements Appendix A Home Depet 205 Finanial Statements THE HOME DEPOT, INC. AND SUBSIDIARIES CONSOLIDATED STATEMENTS OF CASH FLOWs Flscal Year Ended February 1, February 2 2014 January 31, amounts in milions s 7,009 6,345S 5,385 CASH FLOWS FROM OPERATING ACTIVITIES Net Earnings 1,786 225 1.757 1,863 liation of Net Earmings to Net Cash Provided by Operating Activities Depreciation and Amortization Stock- Gain on Sales of Investments Changes in Assets and Liabilities, net of the effects of acquisitions: (144) Based Compensation Expense (181) (546) (124) (199) Receivables, net Merchandise Invensories 605 75 Other Current Assets 109 Accounts Payable and Accrued Expenses 168 159 Deferred Revenue Income Taxes Payable Deferred Income Taxes 15 (31) 8,242 Net Cash Provided by Operating Activities CASH FLOWS FROM INVESTING ACTIVITIES: (1,442) (1,389) (1,503) 144 (1,666) Capital Expenditures, net of s165, $217 and $46 of non-cash capital expenditares in fiscal 2015, 2014 and 2013, respectively Proceeds from Sales of Investments Payments for Businesses Aoquired, net Proceeds from Sales of Property and Equipment Net Cash Used in Investing Activiies (2,982) 1.271) CASH FLOWS FROM FINANCING ACTIVITIES: 290 1,981 60 Proceeds from Short-Term Borrowings, net 3,991 (39) (7,000) 228 (3,031) Proceeds from Long-Term Borrowings, net of discounts (1,289) Repryments of Loog-Term Debr Repurchases of Common Stock Proceeds from Sales of Common Stock Cash Dividends Paid to Stockholders Other Financing Activities (7,000) 252 (2.530) (2.243) Net Cash Used in Financing Activities Change in Cash and Cash Equivalents Effect of Exchange Rate Changes on Cash and Cash Equivalents Cash and Cash Equivalents at Beginning of Year Cash and Cash Equivalents at End of Year SUPPLEMENTAL DISCLOSURE OF CASH PAYMENTS MADE FOR Interest, net of interest capitalized Income Taxes (5,787) (7,071) (100) (106) 1,929 (6,65 (531) 1,723 = 2216 St-L-LE29 $ 874 782 S 639 $ 3,853 3,435 $ 2,839 16 S 1.723 1929 (1) Fiscal years ended January 31,2016, Febrwary I,2015 and February 2, 2014 include 52 weeks See accompanying Notes to Consolidated Financial Statements A Home Depet z015 Financil Statement NOTES TO CONSOLIDATED FINANCIAL STATEMENTS RY OF SIGNIFICANT ACCOUNTING POLICIES Consolidation and Presentation the Home Depox, Inc. .ogether with its sabsidiaries (the "Company, is a home impeovement retailer that sells a wide assort- hent of building materials, home improvement products and lawn and garden products and provides a number of services. The warehouse-style stoces averaging approximately 104,000 square feet of enclosed Depot stores, which are fall-service, Home space, with approximately 24,000 additional square feet of outside garden area, stock approximately 30,000 t0 40000 ditfemt kinds of products that are sold to do-it-yourself cusomes, do-it-for-me cussomers and peofessional customers. The Company stoces websites. At the end of fiscal 2015, the Company was operating 2,274 The Home Depot stores in the United States, including the Commonwealth of Poerto Rico and the territories of the U.S. Virgin U.s."), 182 stores in Canada and 115 stoees in Mexico. The Consolidated Financial Statements inc which included 1,97 stores Islands and Guam include the accounts of the and its wholly-owned subsidiaries. All significan intercom pany transactions have been eliminated in consolidation Fiscal Year The Company's fiscal year is a 52- or 53-weck period ending on the Sunday nearest to January 31. Fiscal years enled January 31, 2016 C"fiscal 2015"). February 1, 2015 fiscal 2014") and Febeuary 2, 2014 fiscal 2013") include 52 weeks. Use of Estimates Management of the Company has made a number of estimates and assumptions relnting to the reporting the disclosure of contingent assets and liabilities, and repoeted amounts of revenues and expenses in preparing these statements in conformity with U.S. generally accepted accounting principles.Actual results could differ from these estimates of assets and liabilities, The carrying amounts of Cash and Cash Equivalens, Receivables, Short-Term Debt sed Accounts Payable approximate fair value due to the short-term maturitsies of these financial instruments. The fair value of the Company's Long-Term Debt is dis- cussed in Note 11. Fair Value of Financial Instruments Cash Equivalents The Company considers all highly liquid investments purchased with original maturities of three months or less to be cash equivalents. The Company's cash equivalents are carried at fair market value and consist primarily of money market funds Accounts Receivable The Company has an agreement with a third-party service provider who directly exiends crodit to customers, manages the Company's private label credit card program and owns the related receivables. The Company evaluated the third-party entities holding the receivables under the program and concluded that they should not be consolidated by the Company. The agree- ment with the third-party service provider expires in January 2018, with the Company having the option, but no obligation, to the receivables at the end of the agreement. The deferred interest charges incurred by the Company for its deferred soffered to its customers are included in Cost of Sales. The interchange fees charged to the Company for the customers use of the cards and any profit sharing with the thind-party service provider are included in Selling, General and Administradive expenses ("SGRA"). The sum of the thiree is relered to by the Company as "the cost of credir" of the privare label credit card program. ion certain subsidiaries of the Company, inclading Interline Brands, Inc.("Imerline"), extend credit directly to custom- n ia the ordinary course of basiness. The receivables due from customers were $253 million and $68 million as of January 31, uary 1, 2015, respectively. The Company's valuation reserve related to accounts receivable was not material tbe Consolidated Financial Statements of the Company as of the end of fiscal 2015 or 2014. Merchadl f the CoyMcnienvensores are stated at telower of cos Gars-in, fins-out) or madket, au dete d by the retail inventory method. As the inventory retail value is adjusted regularly to reflect market conditions, the inves using the retail method approximates the lower of cost or market. Certain subsidiaries, including retail operatior io Canads and Mexico, distribution centers and Interline, record Merchandise Inventories at the lower of cost or market, ories The tory A-10 Appendix A Mome Depot 2015 Finencial Statement a cost method at the end of each quarter to ensure that it is method was not determined by a cost method. These Merchandise Inventories represent approximately 29% of the total Merchandise Inve Inventories represent valued under a cost carried at the lower of cost or market. The valuation allowance for Merchandise Inventories material to the Consolidated Financial ance. The Company evaluates t the inventory valued using Statements of the Company as of the end of fiscal 2015 or 2014 Independent physical inventory counts or cycle counts are taken on a regular basis in erly statod During the period between physical inventory counts in stores, the Company accrues for estimated losses related to shrink on a store-by-stoee basis based on recent shrink results and current trends in the business. Shrink (or in the case of excess inventory, "swel") is the difference between the recorded amount of inventory and the physical inventory. Shrink may occur due to theft, loss, inaccurate mcords for the receipt of inventory or deterioration of goods, among other things chat amounts reflected in the accompanying Consolidased Financial Statements for Merchandise Inventories are prop Income tases are accounted for under the asset and liability method. The Company provides for federal, state and forcien income taxes currently payable, as well as for those deferred due to timing differences between reporting income and expenses for financial satement purposes versus tax purposes. Defierred tax assets and liabilities are recognized for the future tax quences attributable so temporary differences between the financial statement carrying amounts of existing assets and Income Taxes liabili dies and their respective tax bases. Deferred tax assets and liabilities are measured using enacted income tax rates apply to taxable iacome in the a change in income years in which those temporary differences are expected to be recovered or settled. The effect of tax rates is recognized as lacome or expense in the period that includes the enactment date. The Company recognizes the effect of income tax positdions only if those positions are more likely th Recognized income tax positions han not of being sustained. only if those positions are more likely than not of being sustained are measured at the largest amount that is greater than 50% likely of being realized. Changes in recognitsion or messuremens are reflected in the period in which the change in judgment occurs The Company and its eligible subsidiaries file a consolidated U.S. federal income tax return. Non-U.S. subsidiaries and certain U.S subsidiaries, which are consolidated for financial reporting purposes, are not eligible to be included in the Company's cossolidated U.S. Sederal income tax return. Separate provisions for income taxes have been determined for these entities. The Company intends to reinvest substantially all of the unremined earnings of its non-U.S. subsidiaries and postpone their remittance indefinitely. Accordingly, no provision for U.S. income taxes on these earnings was recorded in the accompanying Consolidated Statements of Earnings Depreclation and Amortization The Company's Buildings,Furniture, Fixtures and Equipment are recorded at cost and depreciated using the straight-line method over the estimated useful lives of the assets. Leasehold the original term of the lease or the useful life of the improvement, whichever is shorter. The C ment is depreciated using the following estimated useful lives: Improvements are amortized using the straight-line method over mpany's Property and Equip Baildings Furniture, Fixtures and Eqsipment Leasehold Impeovements Life 5-45 years 2-20 years 5-45 years Capitalized Software Costs The Compary capitalizes certain costs related to the acquisition and development of software and amortizes these costs using the straight-line method over the estimated useful life of the software, which is three to six years. Certain development costs not meeting the criteria for capitalization are expensed as incurred chandise receives paymens from c formed, the amount received is recorded as Deferred Revenue in the accompanying Consolidated Balance Sheets until The Company recognizes revenue, net of estimated returns and sales tax, at the time the customer takes possession of mer or receives services. The liability for sales returns is estimated based on historical return levels. When the Company customers before the the upon the redemption of gift cards in Net Sales. Gift card breakage income is recognized based upon historical redemption pat terns and represents the balance of gift cards for which the Company believes the likelihood of redemption by the customer customer has taken possession of the merchandise or the service has been per- sale or service is complete. The Company also records Deferred Revenue for the sale of gift cards and recognizes this revenue During fiscal 2015, 2014 and 2013, the Compary breakage income. This income is incloded in the 2 recognizaed $27 millie, 532 million and $30 million, nespectively t accompanying Consolidased Statements of Earnings as a reduction of gift card Services Revenue nclude services revenue generated through a variety of installation, home mainsenance and professioeal service Ie these programs, the cussomer selects and porchases maserial for a project, and the Company povides or arranges installation These programs are offered through the Company's suores and in-home sales programs Under certain t Company provides or arranges the installation of a project and the subcontractoe provides maberiali as pon when the both the material and labor are included in services revenue. The Company recognines this nevenue whes service for the customer is complete. All paymests this revense when the received prior to the completion of services are recorded in Deferred Revense ia the accompanying Con lidaied Balance Sheets. Services revenue was $40 bilion. 53.8 billion nd $3.5 bilion for fiscal 3015, 2014 and 2013. Self-Insarance is self-insured for certain losses rolated to general liability (including product liabilizy), workers compensation, medical and automobile claims. The expected uhtimane cost for claims lscurred as of the balance sheet daie is not discounted and is data and actuarial estimates. The Company mainmains network security and peivacy liabiliay insurance coverge to limis the ure to losses such as those that may be caused by a significant compeoenise or breach of the Company's data security. This coverage is discussed further in Nose 13. Prepaid Advertising Television and radio advertising production costs, along with media placement costs, are expensed when the advertisement first appears. Amounts included in Other Current Assets in the accompanying Consolidated Balance Shcets relating to prepey- ments of production costs for print and broadcast advertising as well as sponsorship peomotions were not material ad the end of fiscal 2015 and 2014 Vendor Allowances Vendor allowances primarily consist of volume rebates that are earned as a result of attaining certain puechase levels and adver ising co-op allowances for the promotion of vendors' products that are typically based on guaranteed minimum amounts with additional amounts being carned for ataining certain purchase levels. These vendor allowances are accrued as earned, with hose allowances received as a result of attaining certain purchase levels accrued over the incentive period based on estimoates of purchases co-op allowances earned are initially recorded as a reduction in Merchandise Invento- ries and a subsequent reduction in Cost of Sales when the related product is sold. Certain adverising co-op allowances that are reimbursements of specific, incremental and identifiable costs incurred to promote vendors' peoducts ace recorded as an offset apainst advertising expense. In fiscal 2015, 2014 and 2013, gross advertising expense was $868 million, $884 million and $865 million, respectively, and is included in SG&A. Specific, incremental and identifiable advertising co-op allowances were $129 million, $125 million and $114 million for fiscal 2015, 2014 and 2013, respectively, and are recorded as an offiset t advertising expense in SG&A Volume rebates and certain advertising Cost of Sales Cost of Sales inclades the actual cost of merchandise sold and services performed, the cost of traesportation of merchandise ns or distribution centers to customers, the operating cost of the Company's sourcing and ment center costs and the cost of deferred interest programs distribution setwork, celine fulfill- offered through the Company's private label credit card programs trotm vendors to the Company's stores, locations or customers, shipping and handling costs from the Company's stores, loca- evaluates its long-lived assets each quarter for indicamors of potential impairment. Indicators of impairment carrying c combined with a history of losses, management's decision to relocane or close a sore or other of an asset may not be recoverable. The evaluation for long-lived assets is performed at the lowest level of identifiable Impalrment of Long-Lived Assets inclade current period losses the end of its previously estimated useful life or when changes in other circumstances indicate the cash fnlows, which is generally the individual store level A-12 Appendix A Heme Depet 2015 Rinenclal Satement n sore with indicators of impairment are evaluated by comparing its andiscounted cash flows with its esimate of cash flows includes management's assumptions of cash inflows and outflows directly resulting from the The assets of a with use of those in assets in operasions, inclading gross margin on Net Sales, payroll and related isems, oncupancy costs, insurance allocations and othcr cots to operate a store. II the carrying valoe is greater than the undiscounicd cash hows, an impairment component of SG&A in the accompanying Consolidased Statements of Earnings. When a leased location also recognizes in SG&A the net present value of future lease obligations less estimated sublease inco loss is for the difference between the carrying value and the estimated fair market value. Impairment losses are recorded as a ompany reconded impairments and lease obligation costs on closings and relocations in the ordinary course of which were not material to the Consolidated Financial Statements in fiscal 2015, 2014 or 2013 Goodwill and Other Intanglble Assets Goodwill represents the excess of purchase price over the fair value of net assets acquired. The Company does nou goodwill but does assess the recoverability of goodwill in the third quarter of each fiscal year, or more often if indicatons Company may unit is less than sessments, with titative assessment was rant, by determining whether the fair value of each reporting unit supports its carrying value. Each year the Co assess qualitative factors to determine whether it is more likely than not that the fair value of each carrying amount as a basis for determining whether it is necessary to complete quantitative impairment as a quantitative assessment compleced at least once completed in fiscal 2013 ln fiscal 2015, the Compuny completed its annual assessment of the recoverability of goodwill for its U.S, Canada and Mexicn reporting units. The Company performed qualitative assessments, concluding that the fair value of the reporting units was nor more likely than not less than the carrying value. There were no impairment charges related to goodwill for fiscal 2015, 2014 or 2013 The Company amortizes the cost of ocher intangible assets over their estimated useful lives, which range up to 12 years, unless such lives are deemed indefinie. Intangible assets with indefinite lives are tested in the third quarter of each fiscal year for impairment, or more often if indicators warrant. There were no impairment charges related to other intangible assets for fiscal 2015, 2014 or 2013. Stock-Based Compensation The per share weighted average $13.10, respectively. The fair value of these options fair value of stock options granted during fiscal 2015, 2014 and 2013 was $18.54, $14.13 and was determined at the date of grant using the Black-Scholes option-pricing model with the following assumptions: Fiscal Year Ended February 1,2015 1.7% 22.7% 2.3% 5 years Risk-free interest rae Assumed voleaility Assamed dividend yield Assumed lives of options January 31, 2016 1.4% 20.8% February 2, 2014 0.8% 26.3% 2.2% years 5 years Derivatives The erm debt and its exposure on forei accordance with the Finsncial Accounting Standards Board Accounting Standards Codification ("FASB ASC") Subtopic 815- The fair value of the Company's derivative financial instruments is discussed in Note 11. uses derivative financial insruments from time to time in the management of its interest rate exposure on lo gn currency fluctuations. The Company accounts for its derivative financial instruments in 10 Comprehensive Income Comprebensive Income inclades Net Earnings adjusted for certain gains and losses that are excluded from Net Earnings under U.S. generally accepted accounting principles. Adjustments to Net Earnings and Accumulated Other Comprehensive Incorme consist primarily of foreign currency translation adjustments. Foreign Currency Translation and liabilities denominated in a foreign currency are trnnslated into U.S. dollars at the currenm ruse of exchange on the of the reporting period. Revenues and expenses are generalily translated using anvenge exchange eates for the period an are translated using the actual rate on the day of the transaction. The Company $8.0 billion, $8.5 billion and $8.5 billion for fiscal 2015,2014aed 2013, espectivelty,Long-lived asets outide the US rhe following table presents the Net Sales of each maijor product category (and related services) for each of the last there fiscal and $2.5 billion as of January 31,2016 and February 1, 2015, respectlively the Company ouside the (dollar amounts in millions): Pscal Year Ended February 1, 2015 Product Calegory Jamoary 31, 2016 Net Sales February 2, 2014 %01 Net Sales Net Sales S 7560 7,299 %ofNet Sales SofNn Sales Net Sal. 7,022 7,018 Indoor Garden $ 8,298 9,1% 7,465 84 7.8 7.4 Kitchen and Bath Outdoor Garden Appliances Building Materials Plumbing 6,385 5,70869 7.7 6140 5,382 5,728 5,435 6,396 7.2 7.2 7.1 7.0 6.8 5,740 6.9 6278 6,194 7.4 5,987 2 5,388 5.6536.8 4,9n5 5,721 5,038 Tools 6.8 4,718 6.0 56 3.1 3.0 2,757 3.0 100,0% Total Note: Ceriain percentages may not sum to sotals due to rounding Recent Accounting Pronouncements 2016, the Financial Accounting Sandards Board FASB" issued Accounting Suandards Updaie No. 2016-02 Topic 842)" C"ASU No. 2016-02), which requires an entity that is a lessee to recognize the assets and liabilities arising from leases on the balance sheet. This guidance also requires disclosures about the amounn, timing and uncertainty of arising from leases. This guidance is effective for annual reporting periods beginning after December 15, 2018, periods within those annual periods, using a modified retrospective approach, and early adoption is permitted is evaluating the effect that ASU No. 2016-02 will have on its Consolidaned Financial Statements and related cash flows and interim The Simplifying the Presentation of Debt Issuance Costs" C"ASU No. 2015-03"), which requires an entity to present debe issuance to a recognized debt liability as a direct deduction from the carrying amount of that debt liability, consistent with ascounts. The recognition and measurement guidance for debt issuance costs are not affected by this ASU. This guidance 2015, the FASB issued Accounting Standards Update No. 2015-03, "Interest-Imputation of Interest(Subtopic $35-30) Appendix A Home Depot 2015 Financial Statements is effective for annual reporting periods beginning after December 15, 2015 and for interim and annual reporting periods thereafter, and retrospective application is required. Early adop- tion is permitted for financial statements that have not been previously issued. The Company does not believe that ASU No. 2015-03 will have a material impact on its Consolidated Finan- cial Statements and related disclosures. In August 201S, the FASB issued Accounting Standards Update No. 2015-15, "Interest Imputation of Interest (Subtopic 835-30): Presentation and Subsequent Measurement of Debt Issuance Costs Associated with Line-of-Credit Arrangements" C"ASU No. 2015-15"), which states that ASU No. 2015-03 does not address debt issuance costs for line-of-credit arran ments, and therefore the SEC staff would not object to an entity deferring and presenting these related debt issuance costs as an asset and subsequently amortizing the deferred issuance costs ratably over the term of the line-of-credit arrangement, regardless of whether there are any outstanding borrowings on the line-of-credit arrangement. The Company does not believe that ASU No. 2015-15 will have a material impact on its Consolidated Financial Statements ge- and related disclosures In November 2015, the FASB issued Accounting Standards Update No. 2015-17, "Incomo Taxes (Topic 740): Balance Sheet Classification of Deferred Taxes" C'ASU No. 2015-17"), which requires an entity to present deferred tax assets and liabilities as noncurrent in a clas- sified balance sheet. This guidance is effective for annual reporting periods beginning after December 15, 2016, and interim periods within those annual periods. Early adoption is per- mitted as of the beginning of an interim or annual reporting period. The guidance in this ASU may be applied either prospectively to all deferred tax assets and liabilities or retrospectively to all periods presented. The Company does nox believe that ASU No. 2015-17 will have a material impact on its Consolidated Financial Statements and related disclosures. In May 2014, the FASB issued Accounting Standards Update No. 2014-09, "Revenue from Contracts with Customers (Topic 606)" CASU No. 2014-09"), which requires an entity to rec- ognize revenue to depict the transfer of promised goods or services to customers in an amount that reflects the consideration to which it expects to be entitled in exchange for those goods or services, ASU No. 2014-09 supersedes most existing revenue recognition guidance in U.S. GAAP, and it permits the use of either the retrospective or cumulative effect transition method In August 2015, the FASB issued Accounting Standards Update No. 2015-14, "Revenue from Contracts with Customers (Topic 606);: Deferral of the Effective Date" "ASU No. 2015-14"), which delayed the effective date of ASU No. 2014-09 by one year. As a result, ASU No. 2014-09 is effective for annual reporting periods beginning after December 15, 2017, including interim periods within that reporting period. Early adoption is permitted for annual reporting periods beginning after December 15, 2016, including interim periods within that reporting period. The Company is evaluating the effect that ASU No. 2014-09 will have on its Consolidated Financial Statements and related disclosures Certain amounts in prior fiscal years have been reclassified to conform with the presenta- tion adopted in the current fiscal year. See Note 2 to the Consolidated Financial Statements included in this report. COMPREHENSIVE PROBLEM ea0 ANALYSIS OF THE FINANCIAL STATEMENTS OF A PUBLICI OWNED CORPORATION ome Depot, Inc. This Comprehensive Problem is to acquaint you with the content of the 201S finaial satements are for the fiscal year ended January 31, 2016.) The problem contains three parts, which are independent of one another. Part I is designed to familiarize you w greseral cetents of a company's financial statements; Part Il involves analysis of them with the pany's liqaidity, and Par IIl analyzes the trend in its profitability. U' you work this problem ar a growp assignment, cach group member should be p A good sarting point for understanding the financial statements of a company such as Home Depot, Inc, is to understand the accounting policies used in preparing those state- ments. The first nose accompanying the financial statements provides a brief description of the major accounting policies the company used. Most of the areas discussed in this note have been covered in this text. Part Annual reports inclode not only comparative financial satements but also other sources of information, such as: A molilyear summary of financial highlights, a summary of key statistics for the past 5 or 10 years. Several pages of Notes that accompary the financial statements. Reports by management and by the independent auditors in which they express their respective responsibilities for the financial statements Instructions Answer each of the following qpestions and explain where in the statements, notes, or other sections of the annual report you located the information used in your ans a. How many years all of these cerning these statements? are covered in cach of the primary comparative financial statements? Were statements audited? Name the auditors. What were the auditors' conclusions con- b. Home Depot, Inc.,,combines its statement of retained earnings with another financial state- ment. Where are details about changes in the amount of retained earnings found? Over the three years presented, have the company's annual net cash flows been positive or negative from (1) operating activities, (2) investing activities, and (3) financing activities? Has the company's cash balance increased or decreased during each of these three years? c. Part II Assume that you are the credit manager of a medium-size supplier of building mate- rials and related products. Home Depot wants to make credit purchases from your company with payment due in 60 days. a. As general background, read the first note to the financial statements, "Summary of Significant Accounting Policies." Next, compute the following for the fiscal years 2016, and February 1, 2015 (round percentages to the nearest tenth of computations to one decimal place). L. Current ratio. ending January 31, 1 percent, and other 2. Quick ratio 3. Amount of working capital. change in working capital from the prior year Percentause change in cash and cash equivalents from the prior year. On the basis of your analysis i or a, does the company's liquidity appear to have increased of Home Depot to pay for its purchases, do you see any major consider basis of your analysis in part the year b the most recent fiscal year? Ex the ability of Home Otherthot should enter into your company's decision? Explain. essigns each customer one of the four credit ratings listed below. Assign a ou may refer to any of your computations or observations in parts a companyome Depot, Inc., and write a memorandum explaining your decision. ( credit rating to Ho through c, and to any intormation contained in the annual me repor.) POSSIBLE CREDIT RATINGS Litle or no risk of inability to pay. For customers in this category, we ill Outstasonable order without imposing a credit limit. The customer's credit is reevalusted annually R. Good Customer has good debt-paying ability but is assigned a credit limit that is revicwed every 90 days. Orders above the credit limit are accepted only on a cash basis. c. Marginal Customer appears sound, but credit should be extended only on a 30-day basis and with a relatively low credit limit. Creditworthiness and credit limit are reevaluated every 90 days. Unacceptable Customer does not qualify for credit. D. Part III As general background, study the "Five-Year Summary of Financial and Operating Results." Instructions a. Compute the following for the fiscal years ending January 31, 2016, and February 1, 2015 (round percentages to the nearest tenth of I percent): I. Percentage change in net sales (relative to the prior year). 2 Percentage change in net earnings. 3. Gross profit rate. 4. Net income as a percentage of sales. 5. Return on average total assets. 6. Return on average total equity coeclusion(s). te a statement that describes your conclusion(s) concerning trends in Hom e itablity during the period covered in your analysis in part a above. Jusity your coos ApenlsHme Dupa 2015 THE HOME DEPOT, INC. AND SUBSIDIARIES CONSOLIDATED STATEMENTS OF COMPREHENSIVE INCOME Fiscal Year Ended) January 31, February 1, February 2, $ 7,009 6,345 $ 5,385 412)(510) (329) amounts in millions 2016 2014 Net Earnings Other Comprehensive Loss: Foreign Currency Translation Adjustments Cash Flow Hedges, net of tax Other (34) (12) Total Other Comprehensive Loss COMPREHENSIVE INCOME (351 S 6,563 $ 5.847 5,034 446) (498) S 6563 5.847 (1) Fiscal years ended January 31, 2016, February 1, 2015 and February 2, 2014 include 52 weeks. See accompanying Notes to Consolidated Financial Statements Statements Appends A Home Depot 2015 Financ January 31, 2016 February 1, 2015 amounts in miltions, except share and per share date ASSETS Current Assets: s 2,216 1,723 1,484 11,079 1,016 15,302 38,513 15.793 22.720 1,353 1,890 11,809 1,078 16,993 Cash and Cash Equivalents Receivables, net Other Current Assets Total Current Assets Property and Equipment, at cot Less Accumolased Depreciation and Amortization 2,102 Net Property and Equipment Other Assets $ 42,549 39.946 Total Assets LIABILITIES AND STOCKHOLDERS' EQUITY Current Liabilities: 350 290 1,515 1,566 Short-Term Debt Accounts Piyable 1,391 Accrued Salaries and Related Expenses Sales Taxes Payable 1,468 35 38 1,806 11,269 16,869 1,844 642 30,624 Deferred Revenue 34 Income Taxes Payable Crrent Insallinents of Long-Term Detbe 1,943 12,526 Other Accrued Expenses Total Current Liabilities Long-Term Deht, excluding current installmenes Other Long-Term Liabilities Deferred Income Taxes 1,965 Total Liabilities STOCKHOLDERS' EQUITY Common Stock, per value soos: authorized: 10 billion shares; issued: .772 billion shares at January 31, 2016 and 1.768 billion shares at February 1, 2015; outstanding: 1.252 billion shares at Janusry 31, 2016 and 1.307 billion shares at February 1.201s Paid-In Capital Retained Earnings Accumulated Other Comprehensive Loss Treasury Stock, at cost, 520 million shares at January 31, 2016 and 461 million shares at February 1, 2015 9,347 30,973 (898) 8,885 26,995 (452) Total Stockholders' Equity 33,194) (26.194) Total Liablities and Stockholders' Equity 6,316 9,322 S 39,946 See accompanying Notes to Consolidated Financial Statements. Depot 201S Financiel Statements THE HOME DEPOT, INC. AND SUBSIDIARIES CONSOLIDATED STATEMENTS OF STOCKHOLDERS' EQUITY per share data Shares Amount Capital Earnings Income (Loss) Traur tckcko ulanct, February 3, 2013 1,754 $88 S 79485 20,038 Income (Loss) Shares Amoent 9 (270)(10,694) 17,777 5,385 Shares Isued Under Employee Stock Plans 5,385 103 Tas Eifflect of Stock-Based Foerign Curency Translation Adjustments 123 (329) (12) Cash Flow Hedges, net of tax (12) Ssock Options, Awards and Amortization of Restricted Stock 228 228 (8500) (2,243) Repurchases of Common Stock (111) (,300) Cash Dividends (S1.56 per share) (2,243) (10) Balance, February 2, 2014 Net Earnings Shares Issued Under Employee Stock Plans Tax Efect of Stock-Based Compensation Foreign Currency Translation Adjustments Cash Flow Hedges, net of tax Stock Options, Awards and Amortization of Restricted Stock Repurchases of Commion Stock Cash Dividends ($1.88 per share) Other Balance, February 1, 2015 1,761 S 88 $ 8,402 23,180 6,345 46 (38) S 19194) 12,522 122 122 136 7 136 (S10)_ (510) 225 (7,000) (80) (7,000 - (2,530) (452) (46) (26,194) 9,322 7,009 1,768 S 8 S 8,88S s 26995 S 7,009 Earnings Employee Shares Issued Under Employee Stock Plans4 Tax Effect of Stock-Based Compensation Foreign Currency Translation Adjustments Cash Flow Hedges, net of tax Stock Options, Awards and Amortization of Restricted Stock Repurchases of Common Stock Cash Dividends ($2.36 per share) Balance, January 31, 2016 73 73 145 145 34) 244 (412)_ (412) (34)- -244 (59) (7.000) 7,000) (3,031) (898) (520) (33,194)S 6,316 1,772 $ 88 5 9,347 $ 30,973 $ See accompanying Notes to Consolidated Financial Statements Appendix A Home Depet 205 Finanial Statements THE HOME DEPOT, INC. AND SUBSIDIARIES CONSOLIDATED STATEMENTS OF CASH FLOWs Flscal Year Ended February 1, February 2 2014 January 31, amounts in milions s 7,009 6,345S 5,385 CASH FLOWS FROM OPERATING ACTIVITIES Net Earnings 1,786 225 1.757 1,863 liation of Net Earmings to Net Cash Provided by Operating Activities Depreciation and Amortization Stock- Gain on Sales of Investments Changes in Assets and Liabilities, net of the effects of acquisitions: (144) Based Compensation Expense (181) (546) (124) (199) Receivables, net Merchandise Invensories 605 75 Other Current Assets 109 Accounts Payable and Accrued Expenses 168 159 Deferred Revenue Income Taxes Payable Deferred Income Taxes 15 (31) 8,242 Net Cash Provided by Operating Activities CASH FLOWS FROM INVESTING ACTIVITIES: (1,442) (1,389) (1,503) 144 (1,666) Capital Expenditures, net of s165, $217 and $46 of non-cash capital expenditares in fiscal 2015, 2014 and 2013, respectively Proceeds from Sales of Investments Payments for Businesses Aoquired, net Proceeds from Sales of Property and Equipment Net Cash Used in Investing Activiies (2,982) 1.271) CASH FLOWS FROM FINANCING ACTIVITIES: 290 1,981 60 Proceeds from Short-Term Borrowings, net 3,991 (39) (7,000) 228 (3,031) Proceeds from Long-Term Borrowings, net of discounts (1,289) Repryments of Loog-Term Debr Repurchases of Common Stock Proceeds from Sales of Common Stock Cash Dividends Paid to Stockholders Other Financing Activities (7,000) 252 (2.530) (2.243) Net Cash Used in Financing Activities Change in Cash and Cash Equivalents Effect of Exchange Rate Changes on Cash and Cash Equivalents Cash and Cash Equivalents at Beginning of Year Cash and Cash Equivalents at End of Year SUPPLEMENTAL DISCLOSURE OF CASH PAYMENTS MADE FOR Interest, net of interest capitalized Income Taxes (5,787) (7,071) (100) (106) 1,929 (6,65 (531) 1,723 = 2216 St-L-LE29 $ 874 782 S 639 $ 3,853 3,435 $ 2,839 16 S 1.723 1929 (1) Fiscal years ended January 31,2016, Febrwary I,2015 and February 2, 2014 include 52 weeks See accompanying Notes to Consolidated Financial Statements A Home Depet z015 Financil Statement NOTES TO CONSOLIDATED FINANCIAL STATEMENTS RY OF SIGNIFICANT ACCOUNTING POLICIES Consolidation and Presentation the Home Depox, Inc. .ogether with its sabsidiaries (the "Company, is a home impeovement retailer that sells a wide assort- hent of building materials, home improvement products and lawn and garden products and provides a number of services. The warehouse-style stoces averaging approximately 104,000 square feet of enclosed Depot stores, which are fall-service, Home space, with approximately 24,000 additional square feet of outside garden area, stock approximately 30,000 t0 40000 ditfemt kinds of products that are sold to do-it-yourself cusomes, do-it-for-me cussomers and peofessional customers. The Company stoces websites. At the end of fiscal 2015, the Company was operating 2,274 The Home Depot stores in the United States, including the Commonwealth of Poerto Rico and the territories of the U.S. Virgin U.s."), 182 stores in Canada and 115 stoees in Mexico. The Consolidated Financial Statements inc which included 1,97 stores Islands and Guam include the accounts of the and its wholly-owned subsidiaries. All significan intercom pany transactions have been eliminated in consolidation Fiscal Year The Company's fiscal year is a 52- or 53-weck period ending on the Sunday nearest to January 31. Fiscal years enled January 31, 2016 C"fiscal 2015"). February 1, 2015 fiscal 2014") and Febeuary 2, 2014 fiscal 2013") include 52 weeks. Use of Estimates Management of the Company has made a number of estimates and assumptions relnting to the reporting the disclosure of contingent assets and liabilities, and repoeted amounts of revenues and expenses in preparing these statements in conformity with U.S. generally accepted accounting principles.Actual results could differ from these estimates of assets and liabilities, The carrying amounts of Cash and Cash Equivalens, Receivables, Short-Term Debt sed Accounts Payable approximate fair value due to the short-term maturitsies of these financial instruments. The fair value of the Company's Long-Term Debt is dis- cussed in Note 11. Fair Value of Financial Instruments Cash Equivalents The Company considers all highly liquid investments purchased with original maturities of three months or less to be cash equivalents. The Company's cash equivalents are carried at fair market value and consist primarily of money market funds Accounts Receivable The Company has an agreement with a third-party service provider who directly exiends crodit to customers, manages the Company's private label credit card program and owns the related receivables. The Company evaluated the third-party entities holding the receivables under the program and concluded that they should not be consolidated by the Company. The agree- ment with the third-party service provider expires in January 2018, with the Company having the option, but no obligation, to the receivables at the end of the agreement. The deferred interest charges incurred by the Company for its deferred soffered to its customers are included in Cost of Sales. The interchange fees charged to the Company for the customers use of the cards and any profit sharing with the thind-party service provider are included in Selling, General and Administradive expenses ("SGRA"). The sum of the thiree is relered to by the Company as "the cost of credir" of the privare label credit card program. ion certain subsidiaries of the Company, inclading Interline Brands, Inc.("Imerline"), extend credit directly to custom- n ia the ordinary course of basiness. The receivables due from customers were $253 million and $68 million as of January 31, uary 1, 2015, respectively. The Company's valuation reserve related to accounts receivable was not material tbe Consolidated Financial Statements of the Company as of the end of fiscal 2015 or 2014. Merchadl f the CoyMcnienvensores are stated at telower of cos Gars-in, fins-out) or madket, au dete d by the retail inventory method. As the inventory retail value is adjusted regularly to reflect market conditions, the inves using the retail method approximates the lower of cost or market. Certain subsidiaries, including retail operatior io Canads and Mexico, distribution centers and Interline, record Merchandise Inventories at the lower of cost or market, ories The tory A-10 Appendix A Mome Depot 2015 Finencial Statement a cost method at the end of each quarter to ensure that it is method was not determined by a cost method. These Merchandise Inventories represent approximately 29% of the total Merchandise Inve Inventories represent valued under a cost carried at the lower of cost or market. The valuation allowance for Merchandise Inventories material to the Consolidated Financial ance. The Company evaluates t the inventory valued using Statements of the Company as of the end of fiscal 2015 or 2014 Independent physical inventory counts or cycle counts are taken on a regular basis in erly statod During the period between physical inventory counts in stores, the Company accrues for estimated losses related to shrink on a store-by-stoee basis based on recent shrink results and current trends in the business. Shrink (or in the case of excess inventory, "swel") is the difference between the recorded amount of inventory and the physical inventory. Shrink may occur due to theft, loss, inaccurate mcords for the receipt of inventory or deterioration of goods, among other things chat amounts reflected in the accompanying Consolidased Financial Statements for Merchandise Inventories are prop Income tases are accounted for under the asset and liability method. The Company provides for federal, state and forcien income taxes currently payable, as well as for those deferred due to timing differences between reporting income and expenses for financial satement purposes versus tax purposes. Defierred tax assets and liabilities are recognized for the future tax quences attributable so temporary differences between the financial statement carrying amounts of existing assets and Income Taxes liabili dies and their respective tax bases. Deferred tax assets and liabilities are measured using enacted income tax rates apply to taxable iacome in the a change in income years in which those temporary differences are expected to be recovered or settled. The effect of tax rates is recognized as lacome or expense in the period that includes the enactment date. The Company recognizes the effect of income tax positdions only if those positions are more likely th Recognized income tax positions han not of being sustained. only if those positions are more likely than not of being sustained are measured at the largest amount that is greater than 50% likely of being realized. Changes in recognitsion or messuremens are reflected in the period in which the change in judgment occurs The Company and its eligible subsidiaries file a consolidated U.S. federal income tax return. Non-U.S. subsidiaries and certain U.S subsidiaries, which are consolidated for financial reporting purposes, are not eligible to be included in the Company's cossolidated U.S. Sederal income tax return. Separate provisions for income taxes have been determined for these entities. The Company intends to reinvest substantially all of the unremined earnings of its non-U.S. subsidiaries and postpone their remittance indefinitely. Accordingly, no provision for U.S. income taxes on these earnings was recorded in the accompanying Consolidated Statements of Earnings Depreclation and Amortization The Company's Buildings,Furniture, Fixtures and Equipment are recorded at cost and depreciated using the straight-line method over the estimated useful lives of the assets. Leasehold the original term of the lease or the useful life of the improvement, whichever is shorter. The C ment is depreciated using the following estimated useful lives: Improvements are amortized using the straight-line method over mpany's Property and Equip Baildings Furniture, Fixtures and Eqsipment Leasehold Impeovements Life 5-45 years 2-20 years 5-45 years Capitalized Software Costs The Compary capitalizes certain costs related to the acquisition and development of software and amortizes these costs using the straight-line method over the estimated useful life of the software, which is three to six years. Certain development costs not meeting the criteria for capitalization are expensed as incurred chandise receives paymens from c formed, the amount received is recorded as Deferred Revenue in the accompanying Consolidated Balance Sheets until The Company recognizes revenue, net of estimated returns and sales tax, at the time the customer takes possession of mer or receives services. The liability for sales returns is estimated based on historical return levels. When the Company customers before the the upon the redemption of gift cards in Net Sales. Gift card breakage income is recognized based upon historical redemption pat terns and represents the balance of gift cards for which the Company believes the likelihood of redemption by the customer customer has taken possession of the merchandise or the service has been per- sale or service is complete. The Company also records Deferred Revenue for the sale of gift cards and recognizes this revenue During fiscal 2015, 2014 and 2013, the Compary breakage income. This income is incloded in the 2 recognizaed $27 millie, 532 million and $30 million, nespectively t accompanying Consolidased Statements of Earnings as a reduction of gift card Services Revenue nclude services revenue generated through a variety of installation, home mainsenance and professioeal service Ie these programs, the cussomer selects and porchases maserial for a project, and the Company povides or arranges installation These programs are offered through the Company's suores and in-home sales programs Under certain t Company provides or arranges the installation of a project and the subcontractoe provides maberiali as pon when the both the material and labor are included in services revenue. The Company recognines this nevenue whes service for the customer is complete. All paymests this revense when the received prior to the completion of services are recorded in Deferred Revense ia the accompanying Con lidaied Balance Sheets. Services revenue was $40 bilion. 53.8 billion nd $3.5 bilion for fiscal 3015, 2014 and 2013. Self-Insarance is self-insured for certain losses rolated to general liability (including product liabilizy), workers compensation, medical and automobile claims. The expected uhtimane cost for claims lscurred as of the balance sheet daie is not discounted and is data and actuarial estimates. The Company mainmains network security and peivacy liabiliay insurance coverge to limis the ure to losses such as those that may be caused by a significant compeoenise or breach of the Company's data security. This coverage is discussed further in Nose 13. Prepaid Advertising Television and radio advertising production costs, along with media placement costs, are expensed when the advertisement first appears. Amounts included in Other Current Assets in the accompanying Consolidated Balance Shcets relating to prepey- ments of production costs for print and broadcast advertising as well as sponsorship peomotions were not material ad the end of fiscal 2015 and 2014 Vendor Allowances Vendor allowances primarily consist of volume rebates that are earned as a result of attaining certain puechase levels and adver ising co-op allowances for the promotion of vendors' products that are typically based on guaranteed minimum amounts with additional amounts being carned for ataining certain purchase levels. These vendor allowances are accrued as earned, with hose allowances received as a result of attaining certain purchase levels accrued over the incentive period based on estimoates of purchases co-op allowances earned are initially recorded as a reduction in Merchandise Invento- ries and a subsequent reduction in Cost of Sales when the related product is sold. Certain adverising co-op allowances that are reimbursements of specific, incremental and identifiable costs incurred to promote vendors' peoducts ace recorded as an offset apainst advertising expense. In fiscal 2015, 2014 and 2013, gross advertising expense was $868 million, $884 million and $865 million, respectively, and is included in SG&A. Specific, incremental and identifiable advertising co-op allowances were $129 million, $125 million and $114 million for fiscal 2015, 2014 and 2013, respectively, and are recorded as an offiset t advertising expense in SG&A Volume rebates and certain advertising Cost of Sales Cost of Sales inclades the actual cost of merchandise sold and services performed, the cost of traesportation of merchandise ns or distribution centers to customers, the operating cost of the Company's sourcing and ment center costs and the cost of deferred interest programs distribution setwork, celine fulfill- offered through the Company's private label credit card programs trotm vendors to the Company's stores, locations or customers, shipping and handling costs from the Company's stores, loca- evaluates its long-lived assets each quarter for indicamors of potential impairment. Indicators of impairment carrying c combined with a history of losses, management's decision to relocane or close a sore or other of an asset may not be recoverable. The evaluation for long-lived assets is performed at the lowest level of identifiable Impalrment of Long-Lived Assets inclade current period losses the end of its previously estimated useful life or when changes in other circumstances indicate the cash fnlows, which is generally the individual store level A-12 Appendix A Heme Depet 2015 Rinenclal Satement n sore with indicators of impairment are evaluated by comparing its andiscounted cash flows with its esimate of cash flows includes management's assumptions of cash inflows and outflows directly resulting from the The assets of a with use of those in assets in operasions, inclading gross margin on Net Sales, payroll and related isems, oncupancy costs, insurance allocations and othcr cots to operate a store. II the carrying valoe is greater than the undiscounicd cash hows, an impairment component of SG&A in the accompanying Consolidased Statements of Earnings. When a leased location also recognizes in SG&A the net present value of future lease obligations less estimated sublease inco loss is for the difference between the carrying value and the estimated fair market value. Impairment losses are recorded as a ompany reconded impairments and lease obligation costs on closings and relocations in the ordinary course of which were not material to the Consolidated Financial Statements in fiscal 2015, 2014 or 2013 Goodwill and Other Intanglble Assets Goodwill represents the excess of purchase price over the fair value of net assets acquired. The Company does nou goodwill but does assess the recoverability of goodwill in the third quarter of each fiscal year, or more often if indicatons Company may unit is less than sessments, with titative assessment was rant, by determining whether the fair value of each reporting unit supports its carrying value. Each year the Co assess qualitative factors to determine whether it is more likely than not that the fair value of each carrying amount as a basis for determining whether it is necessary to complete quantitative impairment as a quantitative assessment compleced at least once completed in fiscal 2013 ln fiscal 2015, the Compuny completed its annual assessment of the recoverability of goodwill for its U.S, Canada and Mexicn reporting units. The Company performed qualitative assessments, concluding that the fair value of the reporting units was nor more likely than not less than the carrying value. There were no impairment charges related to goodwill for fiscal 2015, 2014 or 2013 The Company amortizes the cost of ocher intangible assets over their estimated useful lives, which range up to 12 years, unless such lives are deemed indefinie. Intangible assets with indefinite lives are tested in the third quarter of each fiscal year for impairment, or more often if indicators warrant. There were no impairment charges related to other intangible assets for fiscal 2015, 2014 or 2013. Stock-Based Compensation The per share weighted average $13.10, respectively. The fair value of these options fair value of stock options granted during fiscal 2015, 2014 and 2013 was $18.54, $14.13 and was determined at the date of grant using the Black-Scholes option-pricing model with the following assumptions: Fiscal Year Ended February 1,2015 1.7% 22.7% 2.3% 5 years Risk-free interest rae Assumed voleaility Assamed dividend yield Assumed lives of options January 31, 2016 1.4% 20.8% February 2, 2014 0.8% 26.3% 2.2% years 5 years Derivatives The erm debt and its exposure on forei accordance with the Finsncial Accounting Standards Board Accounting Standards Codification ("FASB ASC") Subtopic 815- The fair value of the Company's derivative financial instruments is discussed in Note 11. uses derivative financial insruments from time to time in the management of its interest rate exposure on lo gn currency fluctuations. The Company accounts for its derivative financial instruments in 10 Comprehensive Inco