Compute 2015 - 2018: total asset turnover, total debt to total assets*, total debt to equity, and long-term debt to equity
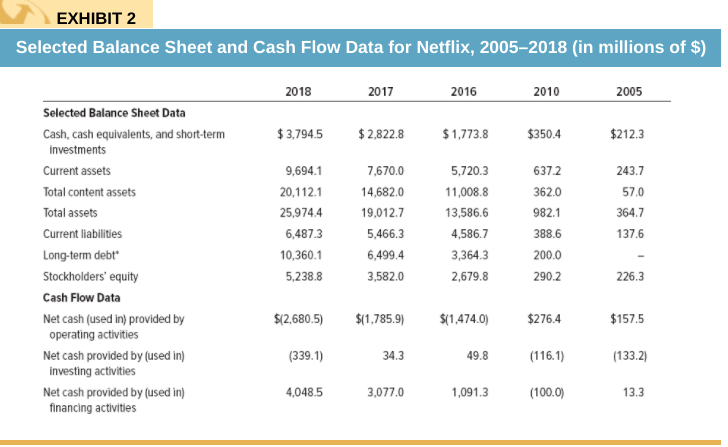
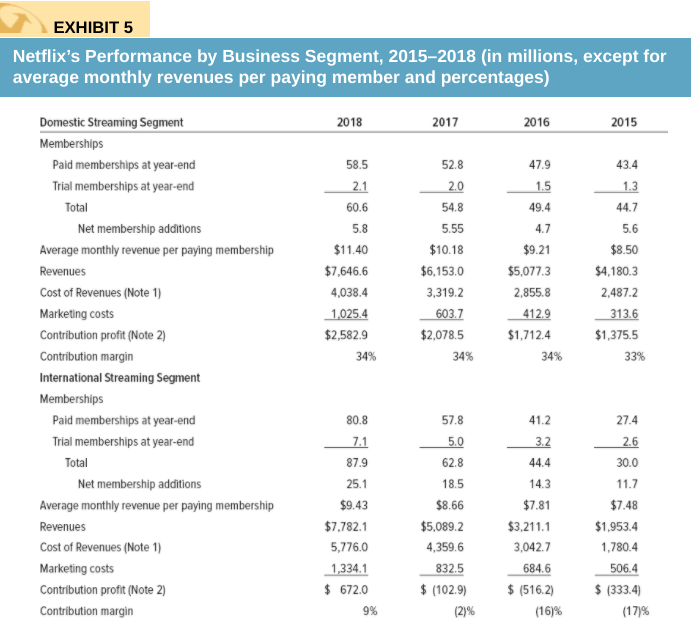
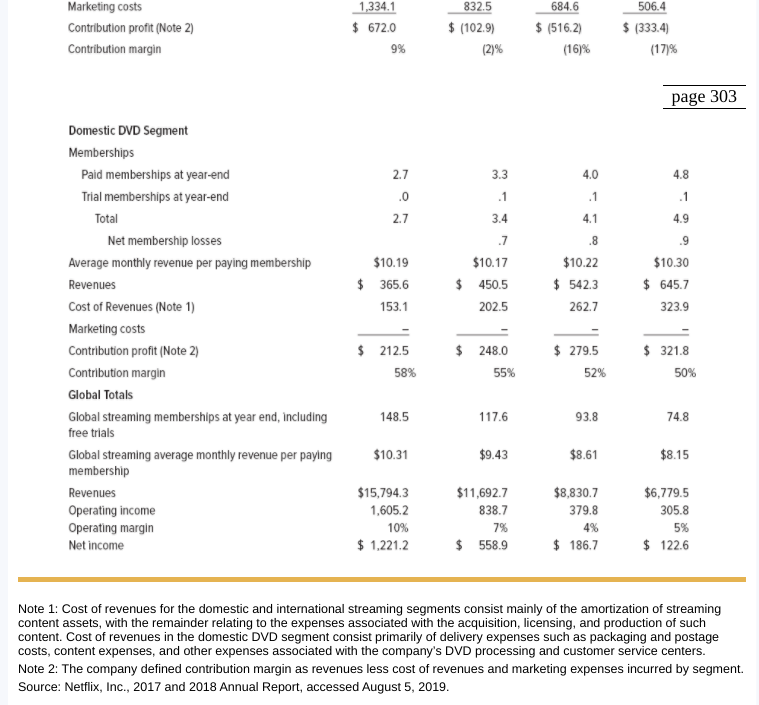
EXHIBIT 2 Selected Balance Sheet and Cash Flow Data for Netflix, 20052018 (in millions of $) 2018 2017 2016 2010 2005 $3,794.5 $ 2,822.8 $1,773.8 $350.4 $212.3 Selected Balance Sheet Data Cash, cash equivalents, and short-term investments Current assets Total content assets Total assets Current liabilities Long-term debt Stockholders' equity Cash Flow Data Net cash (used in provided by operating activities Net cash provided by (used in investing activities Net cash provided by used in) financing activities 9,694.1 20,1121 25,9744 6,487.3 10,360.1 5,238.8 7.670.0 14,682.0 19.012.7 5,466.3 6.499.4 3,582.0 5,720.3 11,008.8 13,586.6 4,586.7 3,364.3 2,679.8 637.2 362.0 982.1 388.6 200.0 290.2 243.7 57.0 364.7 137.6 226.3 $12,680.5) $(1,785.9) $(1,474.0) $276.4 $157.5 (339.1) 34.3 49.8 (116.1) (133.2) 4,048.5 3,077.0 1,091.3 (100.0) 13.3 EXHIBIT 5 Netflix's Performance by Business Segment, 2015-2018 (in millions, except for average monthly revenues per paying member and percentages) 2018 2017 2016 2015 52.8 58.5 2.1 60.6 5.8 $11.40 $7,646.6 4,038.4 1.025.4 $2,582.9 34% 2.0 54.8 5.55 $10.18 $6,153.0 3,319.2 603.7 $2,078.5 34% 47.9 1.5 49.4 4.7 $9.21 $5,077.3 2,855.8 412.9 $1.7124 34% 43.4 1.3 44.7 5.6 $8.50 $4,180.3 2.487.2 313.6 $1,375.5 33% Domestic Streaming Segment Memberships Paid memberships at year-end Trial memberships at year-end Total Net membership additions Average monthly revenue per paying membership Revenues Cost of Revenues (Note 1) Marketing costs Contribution profit (Note 2) Contribution margin International Streaming Segment Memberships Paid memberships at year-end Trial memberships at year-end Total Net membership additions Average monthly revenue per paying membership Revenues Cost of Revenues (Note 1) Marketing costs Contribution profit (Note 2) Contribution margin 80.8 57.8 41.2 27.4 5.0 3.2. 2.6 62.8 18.5 7.1 87.9 25.1 $9.43 $7,782.1 5,776.0 1,334.1 $ 672.0 9% $8.66 $5,089.2 4,359.6 832.5 $ (102.9) 44.4 14.3 $7.81 $3.211.1 3,042.7 684.6 $ (516.2) (16)% 30.0 11.7 $7.48 $1,953.4 1,780.4 506.4 $ (333.4) (17)% (2) Marketing costs Contribution profit (Note 2) Contribution margin 1,334.1 $ 672.0 9% 832.5 $ (102.9) (2)% 684.6 $ (516.2) (16)% 506.4 $ (333.4) (17)% page 303 3.3 4.0 4.8 2.7 .0 2.7 .1 .1 .1 3.4 4.1 4.9 $10.19 $365.6 153.1 .7 $10.17 $ 450.5 202.5 .8 $10.22 $ 542.3 262.7 .9 $10.30 $ 645.7 323.9 Domestic DVD Segment Memberships Paid memberships at year-end Trial memberships at year-end Total Net membership losses Average monthly revenue per paying membership Revenues Cost of Revenues (Note 1) Marketing costs Contribution profit (Note 2) Contribution margin Global Totals Global streaming memberships at year end, including free trials Global streaming average monthly revenue per paying membership Revenues Operating income Operating margin Net income $ 212.5 58% $ 248.0 55% $ 279.5 52% $ 321.8 50% 148.5 117.6 93.8 74.8 $10.31 $9.43 $8.61 $8.15 $15,794.3 1,605,2 10% $ 1.221.2 $11,692.7 838.7 7% $ 558.9 $8,830.7 379.8 4% $ 186.7 $6,779.5 305.8 5% $ 122.6 Note 1: Cost of revenues for the domestic and international streaming segments consist mainly of the amortization of streaming content assets, with the remainder relating to the expenses associated with the acquisition, licensing, and production of such content. Cost of revenues in the domestic DVD segment consist primarily of delivery expenses such as packaging and postage costs, content expenses, and other expenses associated with the company's DVD processing and customer service centers. Note 2: The company defined contribution margin as revenues less cost of revenues and marketing expenses incurred by segment. Source: Netflix, Inc., 2017 and 2018 Annual Report, accessed August 5, 2019