Answered step by step
Verified Expert Solution
Question
1 Approved Answer
Compute a valuation of Rosetta Stone using the market-multiples approach. Please use the financial data in year 2008 and compute: the price per share for
Compute a valuation of Rosetta Stone using the market-multiples approach. Please use the financial data in year 2008 and compute:
the price per share for Rosetta Stone based on the Price/EPS of K12 Inc,
the average Price/EPS of For-profit Education industry,
the average Price/EPS of Internet industry,
and the average Price/EPS of Software industry, respectively.
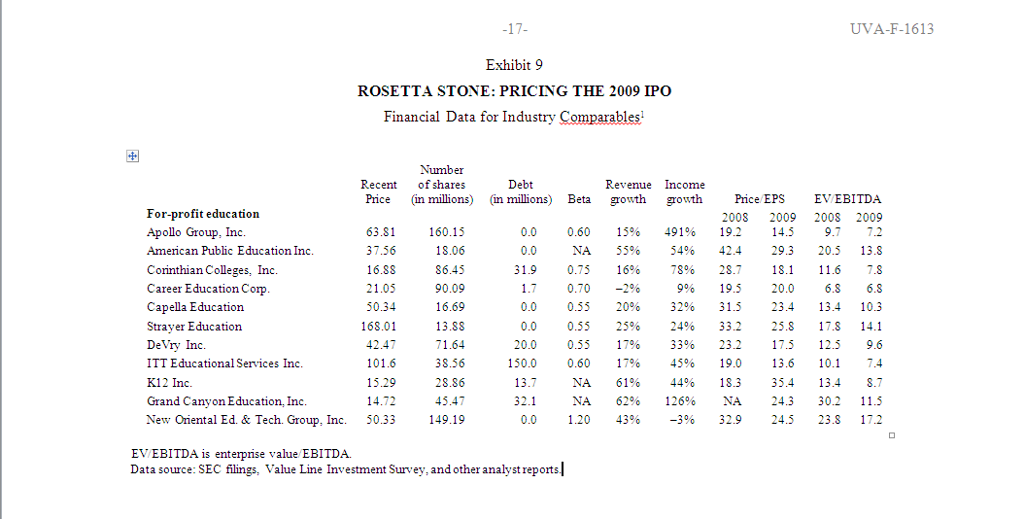
UVA-F-1613 Exhibit 9 ROSETTA STONE: PRICING THE 2009 IPO Financial Data for Industry Comparables Number Debt Recent of shares Price (in millions) (in millions) Beta growth growthPrice EPS EVEBITDA Revenue Income For-profit education Apollo Group, Inc. American Public Education Inc. Corinthian Colleges, Inc. Career Education Corp Capella Education Strayer Education DeVry Inc. ITT Educational Services Inc K12 Inc. Grand Canyon Education, Inc New Oiental Ed. & Tech. Group, Inc. 50.33 63.81 37.56 16.SS 21.05 50.34 68.01 42.47 101.6 15.29 14.72 2008 2009 2008 2009 0.0 0.60 15% 491% 19.2 14.5 9.7 7.2 NA 55% 54% 42.4 29.3 20.5 13.8 31.9 0.75 16% 78% 28.7 18.1 11.6 7.8 996 19.5 20.0 6.8 6.8 0.0 0.55 20% 32% 31.5 23.4 13.4 10.3 0.0 0.55 25% 24% 33.2 25.8 17.8 14.1 20.0 0.55 17% 33% 23.2 17.5 12.5 9.6 150.0 0.60 17% 45% 19.0 13.6 10.1 7.4 NA 61% 44% 18.3 35.4 13.4 8.7 NA 62% 126% NA 24.3 30.2 11.5 -3% 32.9 24.5 23.8 17.2 160.15 18.06 0.0 90.09 16.69 13.SS 71.64 38.56 28.86 45.47 149.19 1.7 0.70-290 13.7 32.1 0.0 1.20 43% EV EBITDA is enterprise value EBITDA. Data source: SEC filings, Value Line Investment Survey, and other analyst reports UVA-F-1613 Exhibit 9 ROSETTA STONE: PRICING THE 2009 IPO Financial Data for Industry Comparables Number Debt Recent of shares Price (in millions) (in millions) Beta growth growthPrice EPS EVEBITDA Revenue Income For-profit education Apollo Group, Inc. American Public Education Inc. Corinthian Colleges, Inc. Career Education Corp Capella Education Strayer Education DeVry Inc. ITT Educational Services Inc K12 Inc. Grand Canyon Education, Inc New Oiental Ed. & Tech. Group, Inc. 50.33 63.81 37.56 16.SS 21.05 50.34 68.01 42.47 101.6 15.29 14.72 2008 2009 2008 2009 0.0 0.60 15% 491% 19.2 14.5 9.7 7.2 NA 55% 54% 42.4 29.3 20.5 13.8 31.9 0.75 16% 78% 28.7 18.1 11.6 7.8 996 19.5 20.0 6.8 6.8 0.0 0.55 20% 32% 31.5 23.4 13.4 10.3 0.0 0.55 25% 24% 33.2 25.8 17.8 14.1 20.0 0.55 17% 33% 23.2 17.5 12.5 9.6 150.0 0.60 17% 45% 19.0 13.6 10.1 7.4 NA 61% 44% 18.3 35.4 13.4 8.7 NA 62% 126% NA 24.3 30.2 11.5 -3% 32.9 24.5 23.8 17.2 160.15 18.06 0.0 90.09 16.69 13.SS 71.64 38.56 28.86 45.47 149.19 1.7 0.70-290 13.7 32.1 0.0 1.20 43% EV EBITDA is enterprise value EBITDA. Data source: SEC filings, Value Line Investment Survey, and other analyst reports
Step by Step Solution
There are 3 Steps involved in it
Step: 1
Get Instant Access to Expert-Tailored Solutions
See step-by-step solutions with expert insights and AI powered tools for academic success
Step: 2
Step: 3
Ace Your Homework with AI
Get the answers you need in no time with our AI-driven, step-by-step assistance
Get Started