

Answered step by step
Verified Expert Solution
Question
1 Approved Answer
compute appropriate ratios to evaluate performance and past performance using the YNF financial history data. Clearly explain what those ratios and trends mean for Mr.
- compute appropriate ratios to evaluate performance and past performance using the YNF financial history data. Clearly explain what those ratios and trends mean for Mr. Zs business. As you can see i have computed the
-
- Calculate gross profit%
- Calculate sg&a%
- Calculate inc%
- What other Ratios is there that i can compute based off the data that i have ?
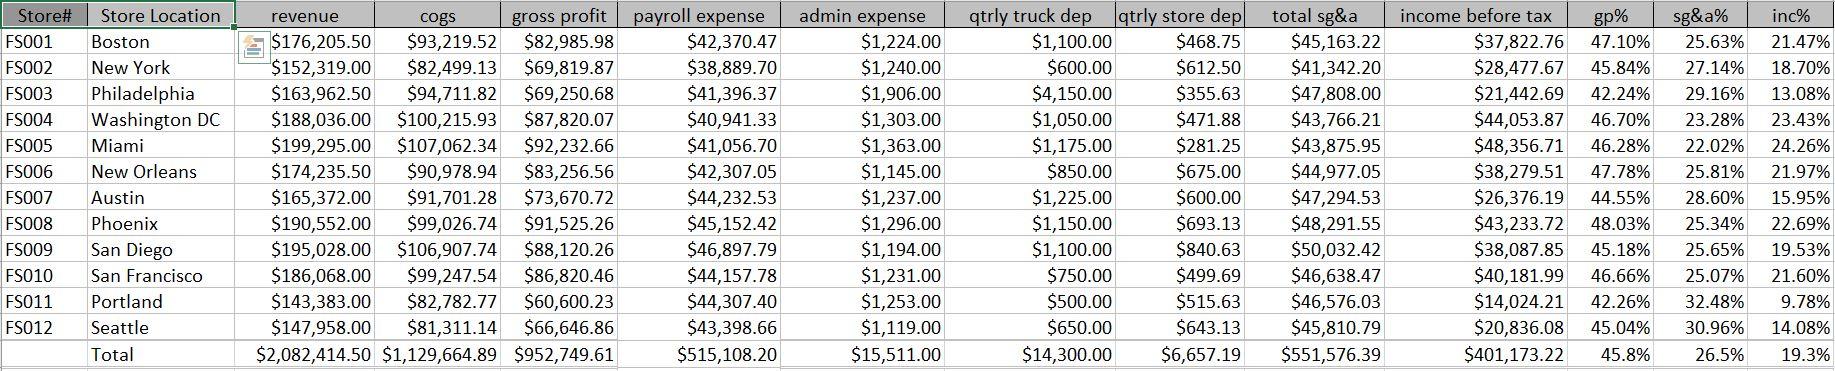
gp% Store# FS001 FS002 FS003 FS004 FS005 FS006 FS007 FS008 FS009 FS010 FS011 FS012 Store Location Boston New York Philadelphia Washington DC Miami New Orleans Austin Phoenix San Diego San Francisco Portland Seattle Total revenue cogs gross profit payroll expense $176,205.50 $93,219.52 $82,985.98 $42,370.47 $152,319.00 $82,499.13 $69,819.87 $38,889.70 $163,962.50 $94,711.82 $69,250.68 $41,396.37 $188,036.00 $100,215.93 $87,820.07 $40,941.33 $199,295.00 $107,062.34 $92,232.66 $41,056.70 $174,235.50 $90,978.94 $83,256.56 $42,307.05 $165,372.00 $91,701.28 $73,670.72 $44,232.53 $190,552.00 $99,026.74 $91,525.26 $45,152.42 $195,028.00 $106,907.74 $88,120.26 $46,897.79 $186,068.00 $99,247.54 $86,820.46 $44,157.78 $143,383.00 $82,782.77 $60,600.23 $44,307.40 $147,958.00 $81,311.14 $66,646.86 $43,398.66 $2,082,414.50 $1,129,664.89 $952,749.61 $515,108.20 admin expense $1,224.00 $1,240.00 $1,906.00 $1,303.00 $1,363.00 $1,145.00 $1,237.00 $1,296.00 $1,194.00 $1,231.00 $1,253.00 $1,119.00 $15,511.00 qtrly truck dep qtrly store dep| $1,100.00 $468.75 $600.00 $612.50 $4,150.00 $355.63 $1,050.00 $471.88 $1,175.00 $281.25 $850.00 $675.00 $1,225.00 $600.00 $1,150.00 $693.13 $1,100.00 $840.63 $750.00 $499.69 $500.00 $515.63 $650.00 $643.13 $14,300.00 $6,657.19 total sg&a $45,163.22 $41,342.20 $47,808.00 $43,766.21 $43,875.95 $44,977.05 $47,294.53 $48,291.55 $50,032.42 $46,638.47 $46,576.03 $45,810.79 $551,576.39 income before tax $37,822.76 $28,477.67 $21,442.69 $44,053.87 $48,356.71 $38,279.51 $26,376.19 $43,233.72 $38,087.85 $40,181.99 $14,024.21 $20,836.08 $401,173.22 47.10% 45.84% 42.24% 46.70% 46.28% 47.78% 44.55% 48.03% 45.18% 46.66% 42.26% 45.04% 45.8% sg&a% 25.63% 27.14% 29.16% 23.28% 22.02% 25.81% 28.60% 25.34% 25.65% 25.07% 32.48% 30.96% 26.5% inc% 21.47% 18.70% 13.08% 23.43% 24.26% 21.97% 15.95% 22.69% 19.53% 21.60% 9.78% 14.08% 19.3% gp% Store# FS001 FS002 FS003 FS004 FS005 FS006 FS007 FS008 FS009 FS010 FS011 FS012 Store Location Boston New York Philadelphia Washington DC Miami New Orleans Austin Phoenix San Diego San Francisco Portland Seattle Total revenue cogs gross profit payroll expense $176,205.50 $93,219.52 $82,985.98 $42,370.47 $152,319.00 $82,499.13 $69,819.87 $38,889.70 $163,962.50 $94,711.82 $69,250.68 $41,396.37 $188,036.00 $100,215.93 $87,820.07 $40,941.33 $199,295.00 $107,062.34 $92,232.66 $41,056.70 $174,235.50 $90,978.94 $83,256.56 $42,307.05 $165,372.00 $91,701.28 $73,670.72 $44,232.53 $190,552.00 $99,026.74 $91,525.26 $45,152.42 $195,028.00 $106,907.74 $88,120.26 $46,897.79 $186,068.00 $99,247.54 $86,820.46 $44,157.78 $143,383.00 $82,782.77 $60,600.23 $44,307.40 $147,958.00 $81,311.14 $66,646.86 $43,398.66 $2,082,414.50 $1,129,664.89 $952,749.61 $515,108.20 admin expense $1,224.00 $1,240.00 $1,906.00 $1,303.00 $1,363.00 $1,145.00 $1,237.00 $1,296.00 $1,194.00 $1,231.00 $1,253.00 $1,119.00 $15,511.00 qtrly truck dep qtrly store dep| $1,100.00 $468.75 $600.00 $612.50 $4,150.00 $355.63 $1,050.00 $471.88 $1,175.00 $281.25 $850.00 $675.00 $1,225.00 $600.00 $1,150.00 $693.13 $1,100.00 $840.63 $750.00 $499.69 $500.00 $515.63 $650.00 $643.13 $14,300.00 $6,657.19 total sg&a $45,163.22 $41,342.20 $47,808.00 $43,766.21 $43,875.95 $44,977.05 $47,294.53 $48,291.55 $50,032.42 $46,638.47 $46,576.03 $45,810.79 $551,576.39 income before tax $37,822.76 $28,477.67 $21,442.69 $44,053.87 $48,356.71 $38,279.51 $26,376.19 $43,233.72 $38,087.85 $40,181.99 $14,024.21 $20,836.08 $401,173.22 47.10% 45.84% 42.24% 46.70% 46.28% 47.78% 44.55% 48.03% 45.18% 46.66% 42.26% 45.04% 45.8% sg&a% 25.63% 27.14% 29.16% 23.28% 22.02% 25.81% 28.60% 25.34% 25.65% 25.07% 32.48% 30.96% 26.5% inc% 21.47% 18.70% 13.08% 23.43% 24.26% 21.97% 15.95% 22.69% 19.53% 21.60% 9.78% 14.08% 19.3%
Step by Step Solution
There are 3 Steps involved in it
Step: 1

Get Instant Access to Expert-Tailored Solutions
See step-by-step solutions with expert insights and AI powered tools for academic success
Step: 2

Step: 3
Ace Your Homework with AI
Get the answers you need in no time with our AI-driven, step-by-step assistance
Get Started
Financial Accounting Preparing Financial Statements AAT Level 3 Study Text And Exam Practice Kit
Authors: MarZar Ltd
1st Edition
979-8846976672