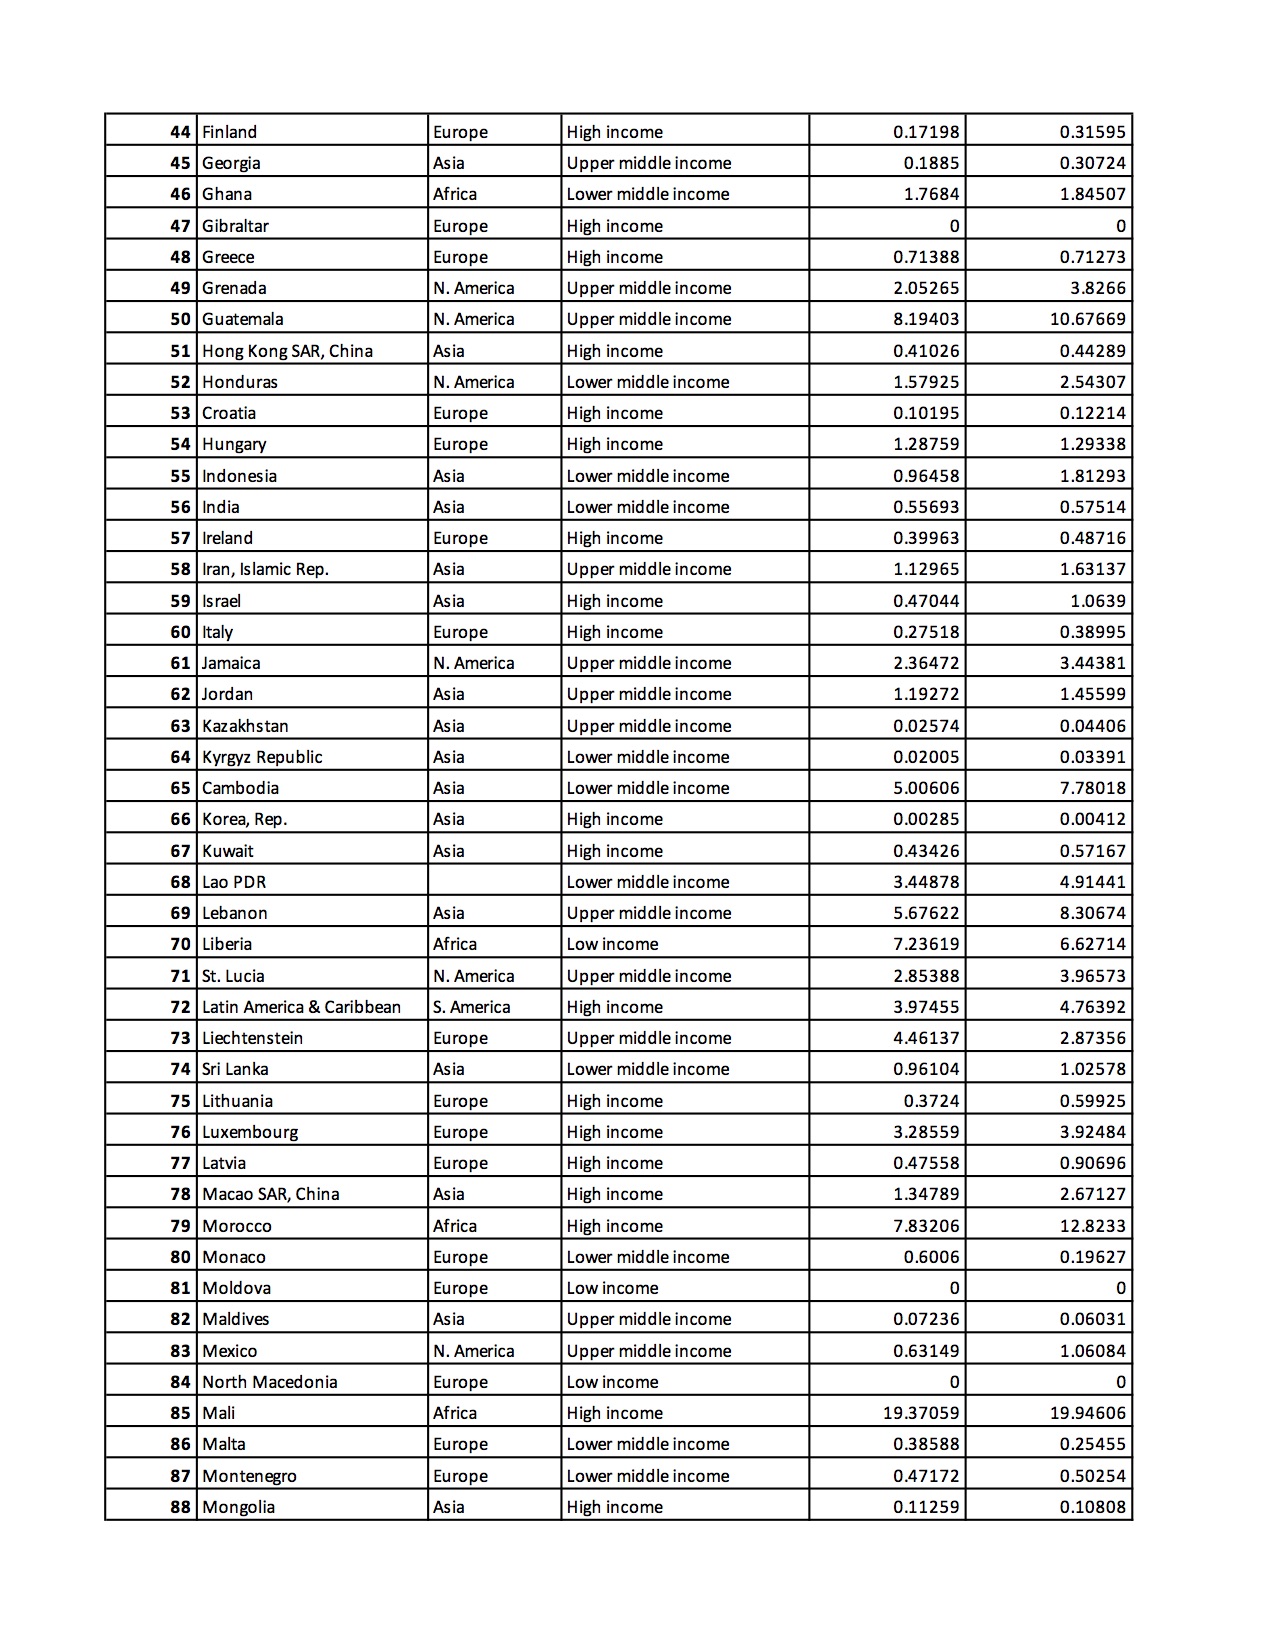
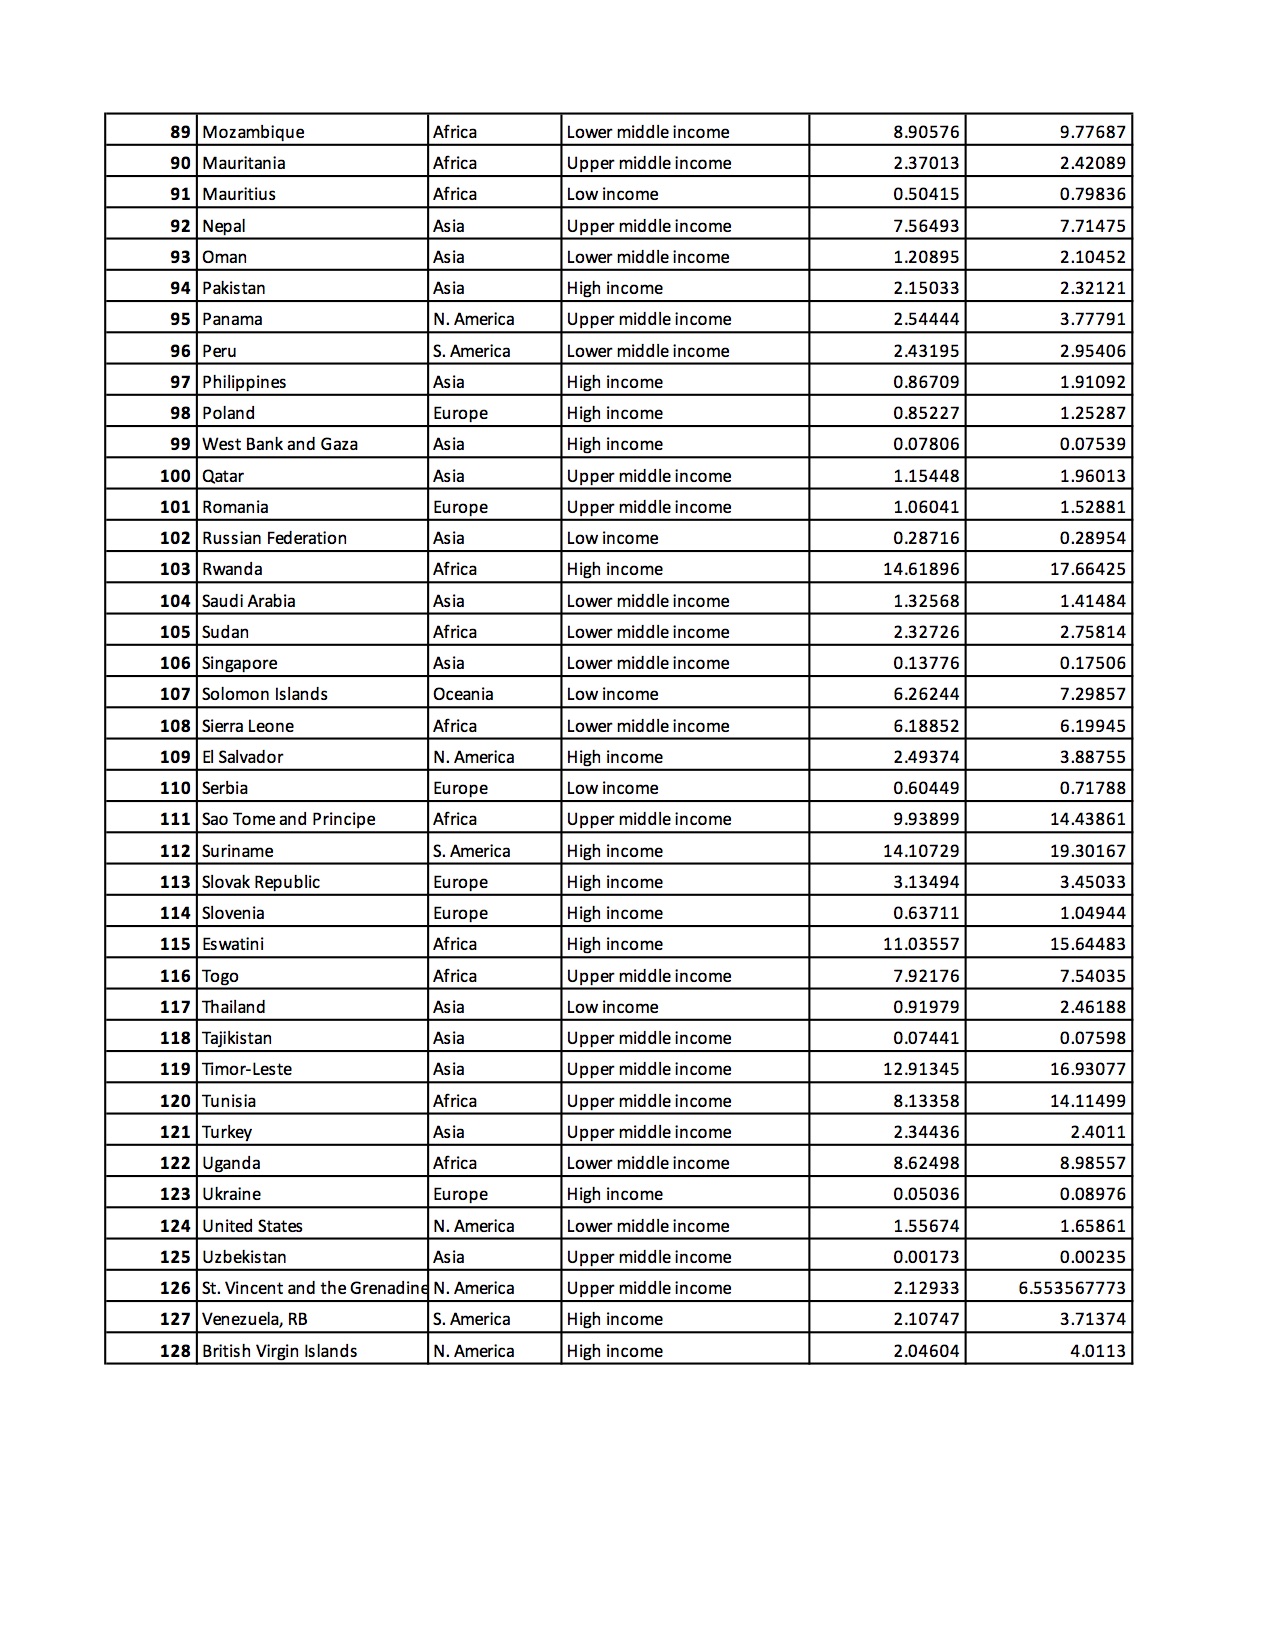
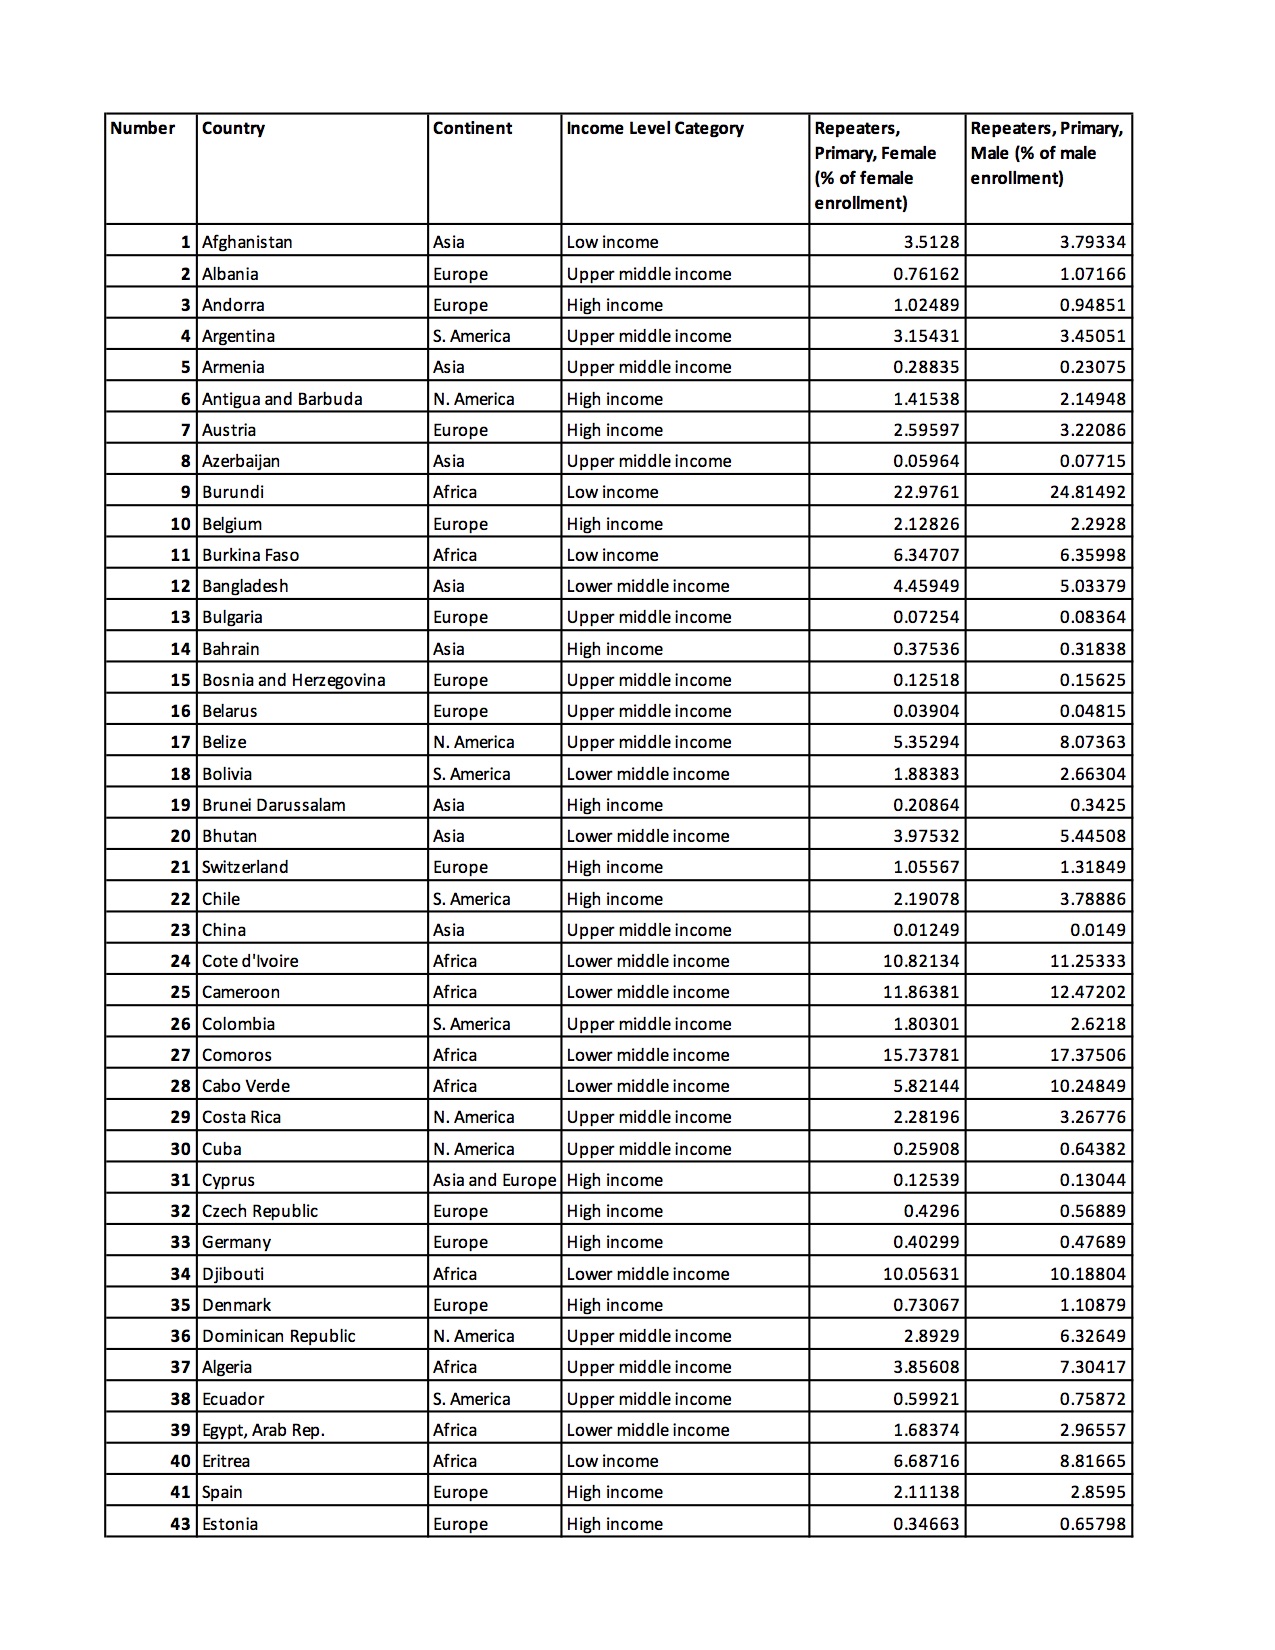
- Compute correlation coefficient.
- Be sure to discuss the strength and direction of the correlation.
- Are the results as expected? What do the results tell you about the relationship of the two variables?
\f\fNumber Country Continent Income Level Category Repeaters Repeaters, Primary, Primary, Female Male (% of male (% of female enrollment enrollment) 1 Afghanistan Asi Low income 3.5128 .79334 2 Albania Europe Upper middle income 0.76162 1.07166 3 Andorra Europe High income 1.02489 0.94851 4 Argentina S. America Upper middle income .15431 .45051 5 Armenia Asia Upper middle income 0.28835 .23075 6 Antigua and Barbuda N. America High income .4153 .14948 7 Austria Europe High income 2.59597 3.22086 B Azerbaijan Asia Upper middle income 0.05964 0.07715 Burundi Africa Low income 22.9761 24.81492 10 Belgium Europe High income 2.12826 2.2928 1 Burkina Faso Africa Low income 6.34707 .35998 12 Bangladesh Asia Lower middle income 4.45949 5.03379 13 Bulgaria Europe Upper middle income 0.07254 0.08364 14 Bahrain Asia High income 0.37536 0.31838 15 Bosnia and Herzegovina Europe Upper middle income 0.12518 .15625 16 Belarus Europe Upper middle income 0.03904 0.04815 17 Belize N. America Upper middle income 5.35294 3.07363 18 Bolivia S. America Lower middle income 1.88383 2.66304 19 Brunei Darussalam Asia High income 0.20864 0.3425 20 Bhutan Asia Lower middle income 3.97532 .44508 21 Switzerland Europe High income 1.05567 1.31849 22 Chile S. America High income 2.19078 3.78886 23 China Asia Upper middle income 0.01249 0.0149 24 Cote d'Ivoire Africa Lower middle income 10.82134 1.25333 25 Cameroon Africa Lower middle income 11.8638 12.47202 26 Colombi S. America Upper middle income 1.80301 2.6218 omoro Africa Lower middle income 15.73781 17.37506 28 Cabo Verde Africa Lower middle income 5.82144 10.24849 29 Costa Rica N. America Upper middle income 2.28196 .26776 30 Cuba N. America Upper middle income 0.25908 0.64382 31 Cyprus Asia and Europe High income .12539 .13044 32 Czech Republic Europe High income 0.4296 .56889 33 German Europe High income 0.40299 0.47689 $4 Djibout Africa Lower middle income 0.05631 0.18804 35 Denmark Europe High income 0.73067 1.10879 36 Dominican Republic N. America Upper middle income 2.8929 6.32649 $7 Algeri Africa Upper middle income 3.85608 7.30417 38 Ecuador S. America Upper middle income 0.59921 0.75872 39 Egypt, Arab Rep Africa Lower middle income 1.68374 .96557 10 Eritrea Africa Low income 5.68716 8.81665 41 Spain Europe High income 2.11138 2.8595 43 Estonia Europe High income .34663 0.65798


