

Question
Compute Cost of Goods Manufactured for Thor Industries for the Fiscal Year ended 7/31/19. Hint: You don't have enough data to solve this by analyzing
Compute Cost of Goods Manufactured for Thor Industries for the Fiscal Year ended 7/31/19. Hint: You don't have enough data to solve this by analyzing the WIP account. You'll have to find another way - by analyzing another account. Show all your calculations.
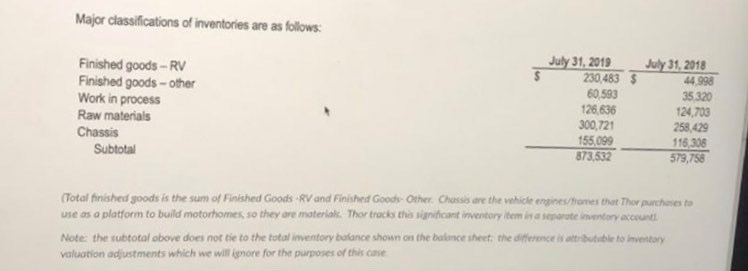
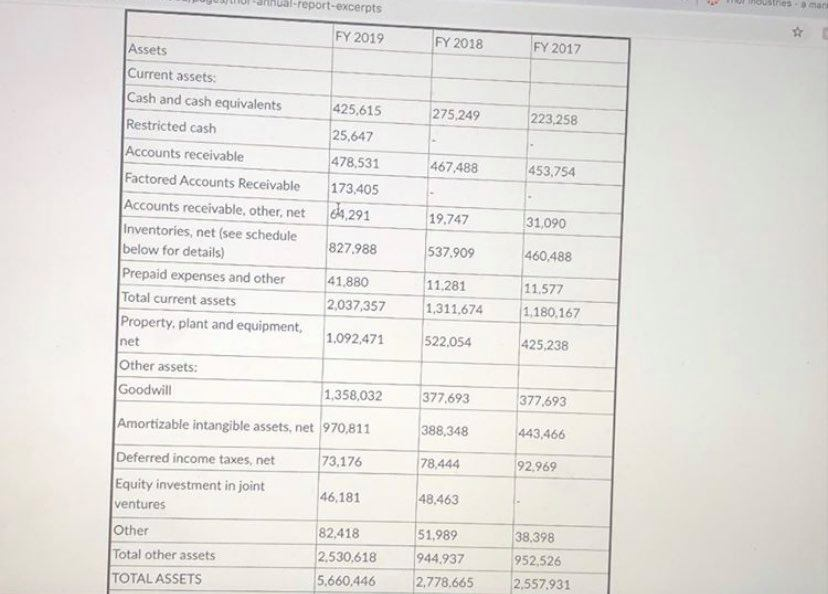
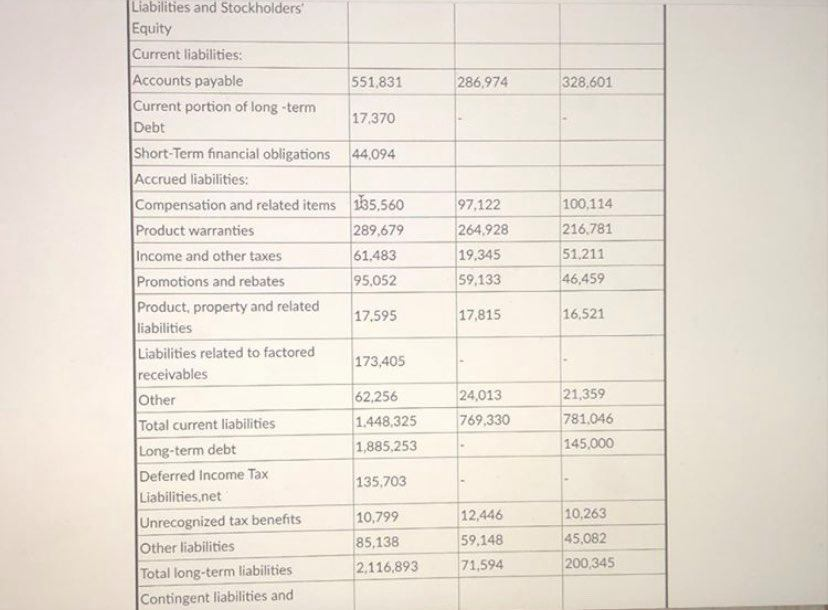
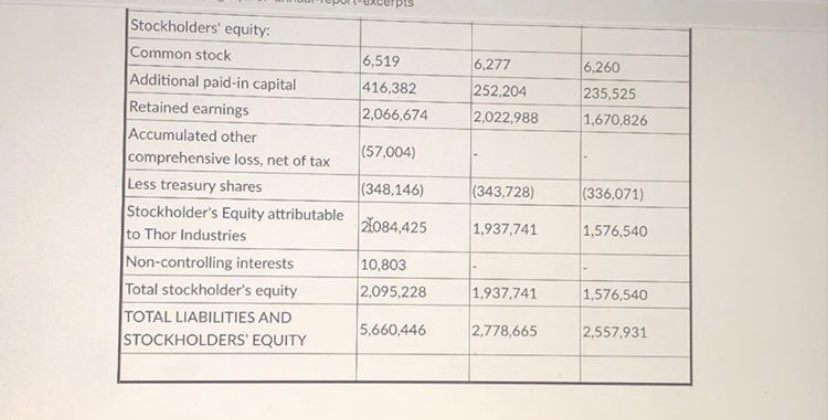
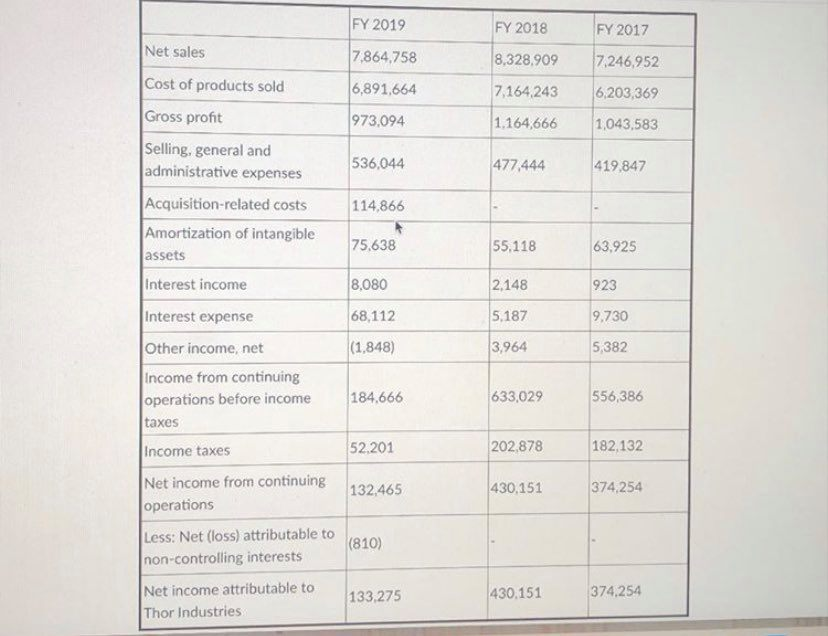
Major classifications of inventories are as follows: Finished goods - RV Finished goods - other Work in process Raw materials Chassis Subtotal July 31, 2019 230,483 $ 60.593 126,636 300,721 155099 873,532 July 31, 2018 44.998 35320 124,700 258,429 116,308 579,758 (Total finished goods is the sum of Finished Goods - RV and Finished Goods Other Chassis are the vehicle engines/frames that Thor purchases to use as a platform to build motorhomes, so they are material. Thor tracks this significant inventory item in a separate inventory account Note: the subtotal above does not tie to the total inventory balance shown on the balance sheet the difference is totable to inventory valuation adjustments which we will ignore for the purposes of this case Thual-report-excerpts san FY 2019 FY 2018 FY 2017 275,249 223,258 425,615 25,647 478,531 467.488 453,754 Assets Current assets Cash and cash equivalents Restricted cash Accounts receivable Factored Accounts Receivable Accounts receivable, other, net Inventories, net (see schedule below for details) Prepaid expenses and other Total current assets Property, plant and equipment, net Other assets: Goodwill 173.405 01.291 19,747 31,090 827,988 537.909 460,488 41.880 2,037,357 11.281 1,311,674 11.577 1.180.167 1,092,471 522,054 425,238 1,358,032 377,693 377,693 Amortizable intangible assets, net 970,811 388,348 443,466 73,176 78.444 92.969 46.181 48,463 Deferred income taxes, net Equity investment in joint ventures Other Total other assets TOTAL ASSETS 51,989 82,418 2.530,618 5,660,446 944.937 2,778.665 38,398 952,526 2,557,931 286,974 328.601 97.122 264,928 19,345 59,133 100,114 216,781 51.211 46,459 Liabilities and Stockholders Equity Current liabilities: Accounts payable 551.831 Current portion of long-term 17,370 Debt Short-Term financial obligations 44,094 Accrued liabilities: Compensation and related items 165,560 Product warranties 289.679 Income and other taxes 61.483 Promotions and rebates 95,052 Product property and related 17.595 liabilities Liabilities related to factored 173,405 receivables Other 62,256 Total current liabilities 1.448,325 Long-term debt 1,885,253 Deferred Income Tax 135,703 Liabilities.net Unrecognized tax benefits 10,799 Other liabilities 85.138 Total long-term liabilities 2.116,893 Contingent liabilities and 17.815 16,521 24,013 769,330 21,359 781,046 145,000 10,263 12,446 59.148 71,594 45,082 200.345 6,519 416,382 2,066,674 6,277 252,204 2,022,988 6,260 235,525 1,670,826 (57.004) Stockholders' equity: Common stock Additional paid-in capital Retained earnings Accumulated other comprehensive loss, net of tax Less treasury shares Stockholder's Equity attributable to Thor Industries Non-controlling interests Total stockholder's equity TOTAL LIABILITIES AND STOCKHOLDERS' EQUITY (348,146) (343.728) (336,071) 21084,425 1,937,741 1,576.540 10,803 2,095,228 1.937,741 1,576,540 5,660.446 2.778,665 2,557,931 FY 2019 FY 2018 FY 2017 Net sales 7,864,758 8,328.909 7,246,952 6,891,664 7,164,243 6,203,369 973,094 1.164,666 1,043,583 536,044 477.444 419,847 114,866 75,638 55,118 63.925 8,080 2.148 923 68,112 5.187 9,730 Cost of products sold Gross profit Selling, general and administrative expenses Acquisition-related costs Amortization of intangible assets Interest income Interest expense Other income, net Income from continuing operations before income taxes Income taxes Net income from continuing operations Less: Net (loss) attributable to non-controlling interests Net income attributable to Thor Industries (1.848) 3,964 5,382 184,666 633,029 556,386 52.201 202.878 182,132 132,465 430,151 374,254 (810) 133,275 430,151 374,254
Step by Step Solution
There are 3 Steps involved in it
Step: 1

Get Instant Access to Expert-Tailored Solutions
See step-by-step solutions with expert insights and AI powered tools for academic success
Step: 2

Step: 3
Ace Your Homework with AI
Get the answers you need in no time with our AI-driven, step-by-step assistance
Get Started
Audit Of The Universe Are We Guarding Our Cocooning Atmosphere Watching Over Our Life Giving Water And Fertile Soil Respecting Our Nourishing Flora And Prodigious Fauna Are We Managing Earths Resources For Better Or Worse
Authors: Sam Kneller
1st Edition
B08DBYMT4K, 979-8668249695