Answered step by step
Verified Expert Solution
Question
1 Approved Answer
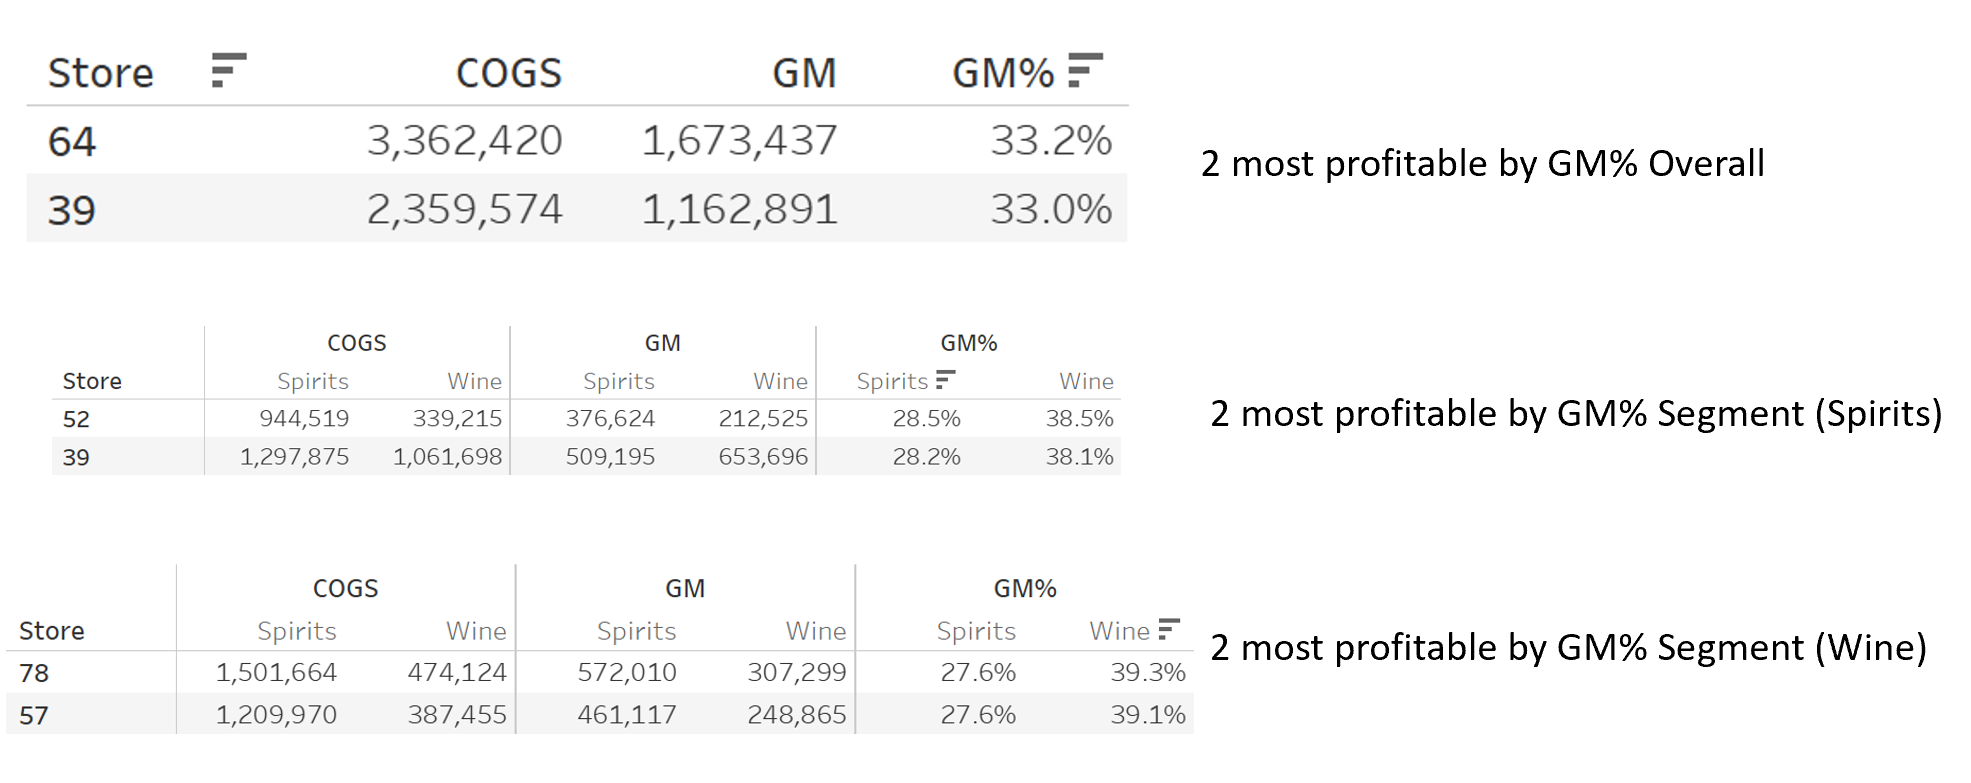
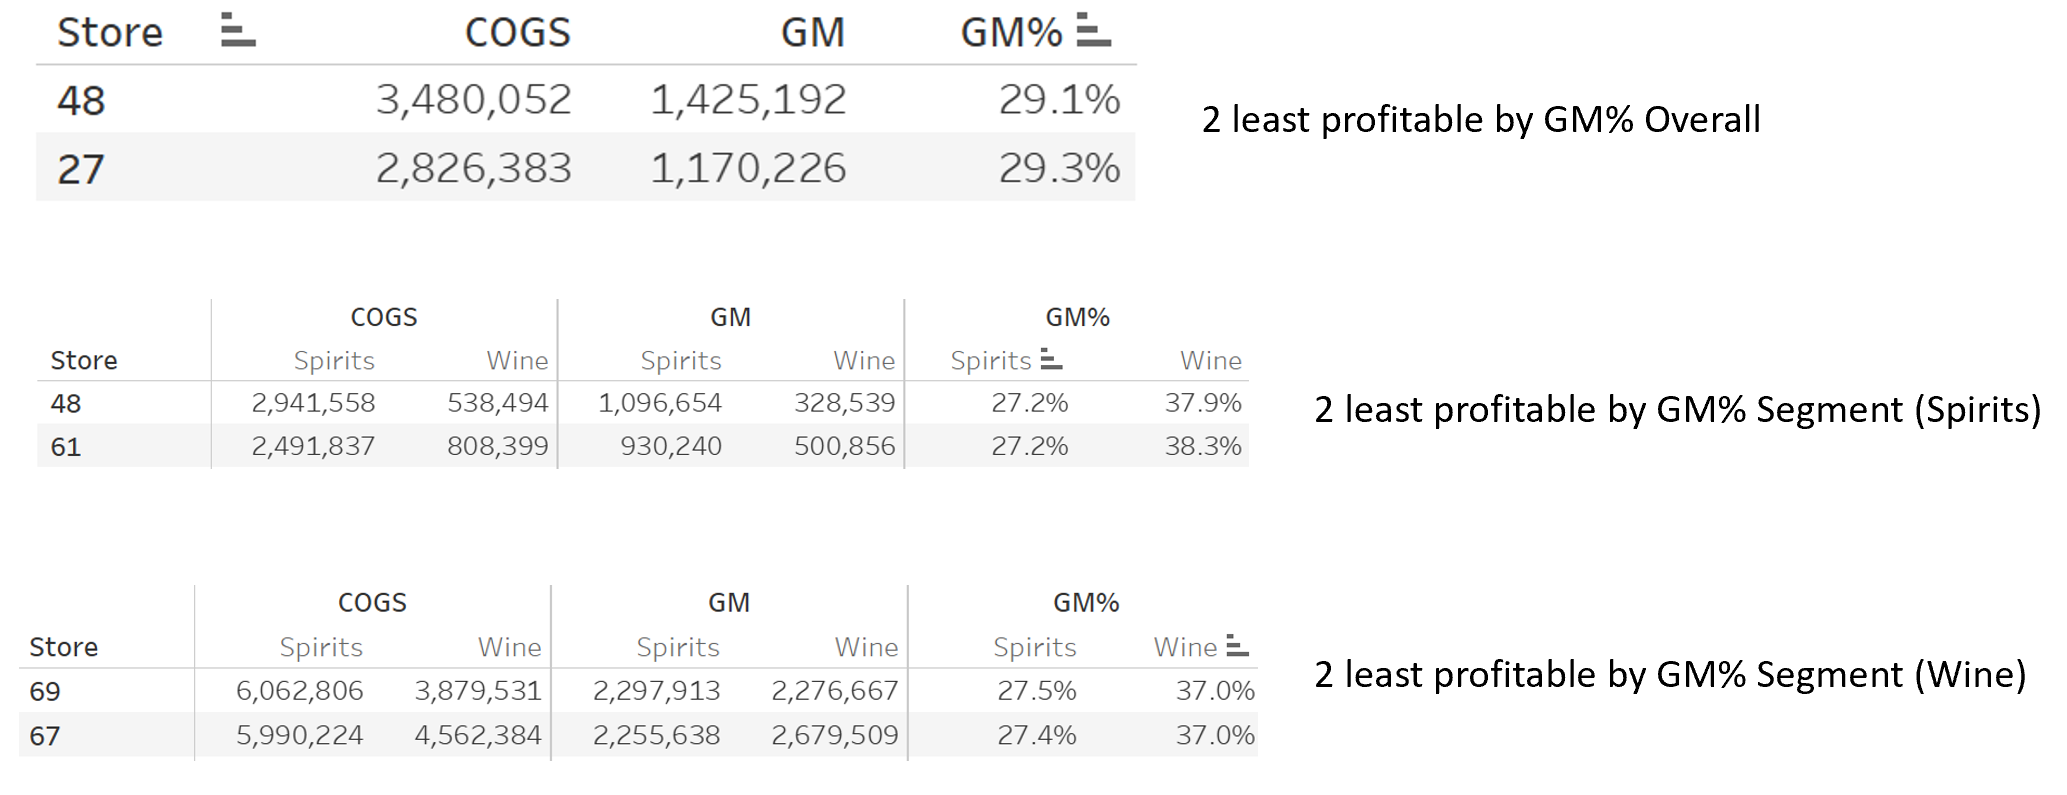
Compute cost of goods sold (COGS), gross margin, and gross margin % in total and by store.2 Identify the two most profitable and the two

 Compute cost of goods sold (COGS), gross margin, and gross margin % in total and by store.2 Identify the two most profitable and the two least profitable stores overall and by segment. Provide the CFO at least two reasons why this profitability analysis is important for managing Bibitor.
I have already calculated the data in Tableau just need the part in bold answered please.
F Store 64 COGS 3,362,420 2,359,574 GM 1,673,437 1,162,891 GM% = 33.2% 33.0% 2 most profitable by GM% Overall 39 COGS GM Store Wine Wine Wine Spirits 944,519 1,297,875 52 GM% Spirits 28.5% 28.2% Spirits 376,624 509,195 339,215 1,061,698 212,525 653,696 38.5% 38.1% 2 most profitable by GM% Segment (Spirits) 39 Store COGS Spirits 1,501,664 1,209,970 GM Spirits 572,010 461,117 Wine 474,124 387,455 Wine ? - 2 most profitable by GM% Segment (Wine) GM% Spirits 27.6% 78 Wine 307,299 248,865 39.3% 57 27.6% 39.1% Store E 48 COGS 3,480,052 2,826,383 GM 1,425,192 1,170,226 GM% = 29.1% 29.3% 2 least profitable by GM% Overall 27 GM Store COGS Spirits 2,941,558 2,491,837 Wine 538,494 808,399 48 Spirits 1,096,654 930,240 GM% Spirits : 27.2% 27.2% Wine 328,539 500,856 Wine 37.9% 38.3% 2 least profitable by GM% Segment (Spirits) 61 Store COGS Spirits Wine 6,062,806 3,879,531 5,990,224 4,562,384 GM Spirits 2,297,913 2,255,638 GM% Spirits 27.5% Wine 2,276,667 2,679,509 Wine E 37.0% 69 2 least profitable by GM% Segment (Wine) 67 27.4% 37.0%Step by Step Solution
There are 3 Steps involved in it
Step: 1

Get Instant Access to Expert-Tailored Solutions
See step-by-step solutions with expert insights and AI powered tools for academic success
Step: 2

Step: 3

Ace Your Homework with AI
Get the answers you need in no time with our AI-driven, step-by-step assistance
Get Started


