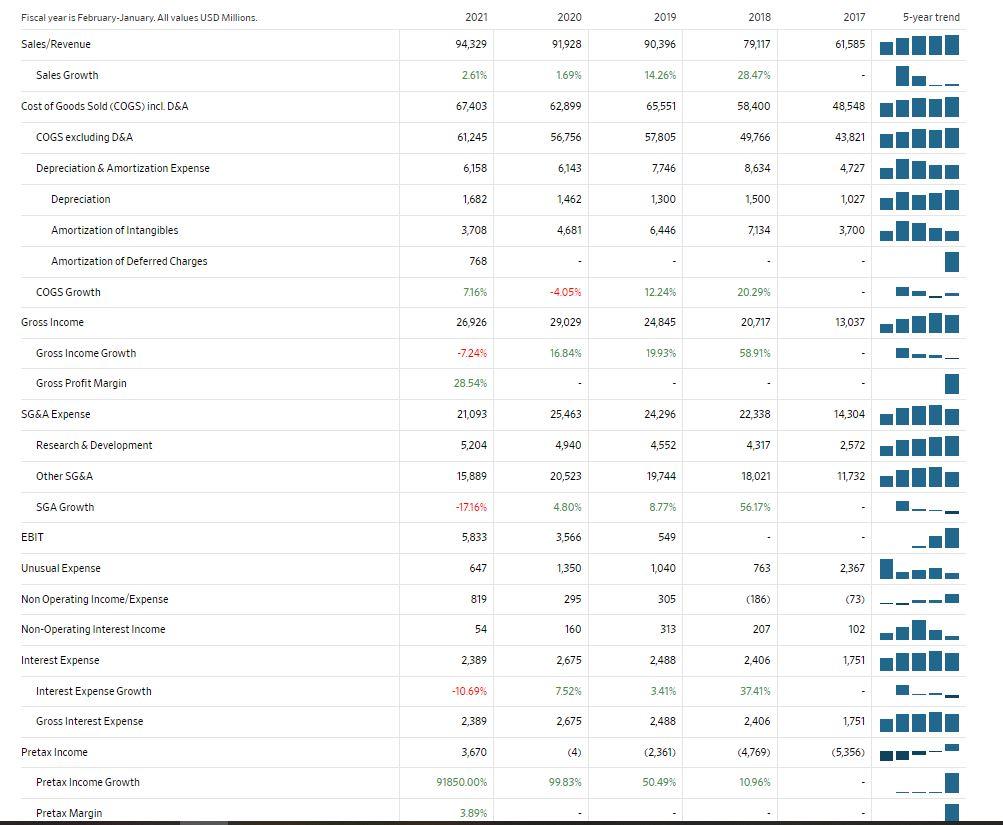
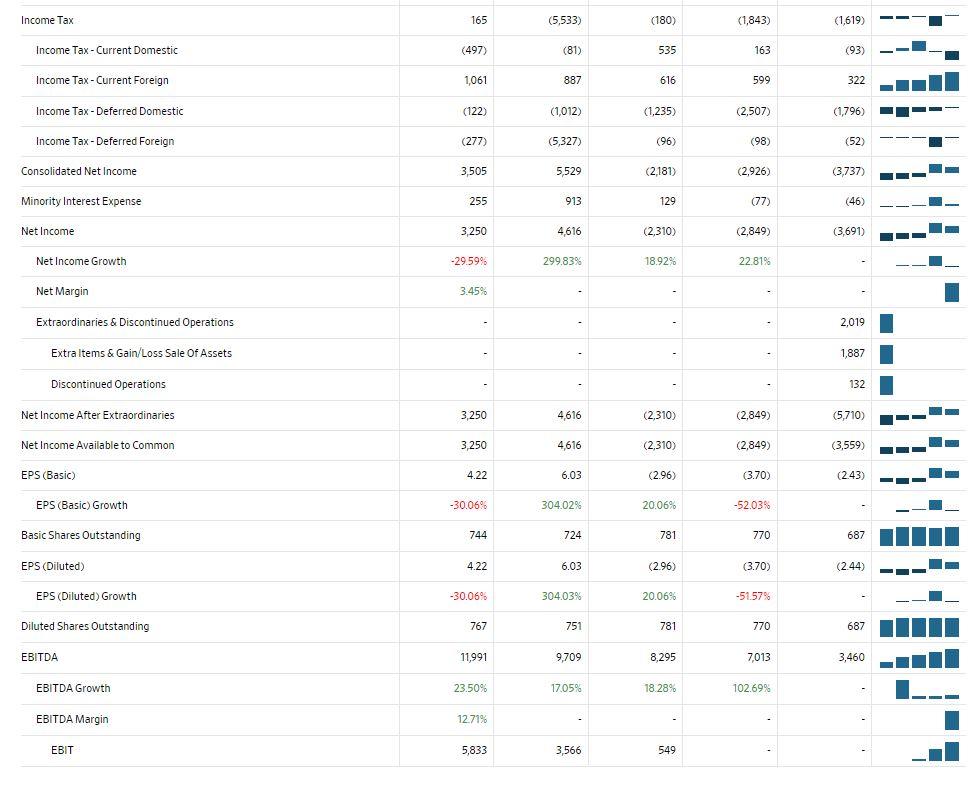
- Compute the following for each of the two most recent years.
- Profit margin
- Return on shareholders' equity
- Current ratio
- Interest coverage ratio
Profit margin = Net income / Net sales
Return on shareholders equity = Net income ( Annual) / Shareholders equity
Current Ratio= Current Assets / Current Liabilities
Interest coverage ratio = EBIT/ Interest expenses
2. If you were an accountant for a potential vendor for this company, explain which of these ratios would be of the most interest to you. Would there also be a second ratio of interest to you?
3. If you were an accountant for a potential investor in this company, explain which of these ratios would be of the most interest to you. In your opinion, what other ratio or ratios beyond the ones listed above should also be considered in an investment context?
4. What is your overall opinion of this company based on the limited analysis completed via the four ratios? Feel free to mention any questions that you feel should still be considered in view of the ratios or the changes from one year to the next.


Fiscal year is February January. All values USD Millions. 2021 2020 2019 2018 2017 5-year trend Sales/Revenue 94,329 91,928 90,396 79,117 61,585 Sales Growth 2.61% 1.69% 14.26% 28.47% Cost of Goods Sold (COGS) incl. D&A 67,403 62,899 65,551 58,400 48,548 COGS excluding D&A 61,245 56,756 57,805 49,766 43,821 Depreciation & Amortization Expense 6,158 6,143 7,746 8,634 4,727 Depreciation 1,682 1,462 1,300 1,500 1,027 Amortization of Intangibles 3,708 4,681 6,446 7134 3,700 Amortization of Deferred Charges 768 COGS Growth 7.16% -4.05% 12.24% 20.29% Gross Income 26.926 29,029 24,845 20,717 13,037 Gross Income Growth -7.24% 16.84% 19.93% 58.91% Gross Profit Margin 28.54% SG&A Expense 21,093 25,463 24,296 22,338 14,304 Research & Development 5,204 4,940 4,552 4317 2572 Other SG&A 15,889 20,523 19,744 18,021 11,732 SGA Growth -17.16% 4.80% 8.77% 56.17% EBIT 5,833 3,566 549 Unusual Expense 647 1,350 1040 763 2,367 Non Operating Income/Expense 819 295 305 (186) (73) Non-Operating Interest Income 54 160 313 207 102 Interest Expense 2,389 2,675 2,488 2,406 1,751 Interest Expense Growth -10.69% 7.52% 3.41% 37.41% Gross Interest Expense 2,389 2.675 2,488 2,406 1,751 Pretax Income 3,670 (4) (2361) (4,769) (5,356) Pretax Income Growth 91850.00% 99.83% 50.49% 10.96% Pretax Margin 3.89% Income Tax 165 (5,533) (180) (1,843) (1,619) Income Tax - Current Domestic (497) (81) 535 163 (93) Income Tax - Current Foreign 1,061 887 616 599 322 Income Tax-Deferred Domestic (122) (1,012 (1,235) (2,507 (1,796) Income Tax-Deferred Foreign (277) (5,327) (96) (98) (52) Consolidated Net Income 3,505 5529 (2,181) (2,926) (3,737) Minority Interest Expense 255 913 129 (77) (46) Net Income 3.250 4,616 (2,310) (2,849) (3,691) Net Income Growth -29.59% 299.83% 18.92% 22.81% Net Margin 3.45% Extraordinaries & Discontinued Operations 2,019 Extra Items & Gain/Loss Sale Of Assets 1,887 Discontinued Operations 132 Net Income After Extraordinaries 3,250 4,616 (2,310) (2,849) (5710) LS Net Income Available to Common 3,250 4,616 (2,310) (2,849) (3,559) EPS (Basic) 4.22 6.03 (2.96) (3.70) (243) EPS (Basic) Growth -30.06% 304.02% 20.06% -52.03% Basic Shares Outstanding 744 724 781 770 687 EPS (Diluted) 4.22 6.03 (2.96) (3.70) (2.44) EPS (Diluted) Growth -30.069 304.03% 20.06% -51.57% Diluted Shares Outstanding 767 751 781 770 687 EBITDA 11,991 9,709 8,295 7,013 3,460 EBITDA Growth 23.50% 17.05% 18.28% 102.699 EBITDA Margin 12.71% - EBIT 5,833 3,566 549 Fiscal year is February January. All values USD Millions. 2021 2020 2019 2018 2017 5-year trend Sales/Revenue 94,329 91,928 90,396 79,117 61,585 Sales Growth 2.61% 1.69% 14.26% 28.47% Cost of Goods Sold (COGS) incl. D&A 67,403 62,899 65,551 58,400 48,548 COGS excluding D&A 61,245 56,756 57,805 49,766 43,821 Depreciation & Amortization Expense 6,158 6,143 7,746 8,634 4,727 Depreciation 1,682 1,462 1,300 1,500 1,027 Amortization of Intangibles 3,708 4,681 6,446 7134 3,700 Amortization of Deferred Charges 768 COGS Growth 7.16% -4.05% 12.24% 20.29% Gross Income 26.926 29,029 24,845 20,717 13,037 Gross Income Growth -7.24% 16.84% 19.93% 58.91% Gross Profit Margin 28.54% SG&A Expense 21,093 25,463 24,296 22,338 14,304 Research & Development 5,204 4,940 4,552 4317 2572 Other SG&A 15,889 20,523 19,744 18,021 11,732 SGA Growth -17.16% 4.80% 8.77% 56.17% EBIT 5,833 3,566 549 Unusual Expense 647 1,350 1040 763 2,367 Non Operating Income/Expense 819 295 305 (186) (73) Non-Operating Interest Income 54 160 313 207 102 Interest Expense 2,389 2,675 2,488 2,406 1,751 Interest Expense Growth -10.69% 7.52% 3.41% 37.41% Gross Interest Expense 2,389 2.675 2,488 2,406 1,751 Pretax Income 3,670 (4) (2361) (4,769) (5,356) Pretax Income Growth 91850.00% 99.83% 50.49% 10.96% Pretax Margin 3.89% Income Tax 165 (5,533) (180) (1,843) (1,619) Income Tax - Current Domestic (497) (81) 535 163 (93) Income Tax - Current Foreign 1,061 887 616 599 322 Income Tax-Deferred Domestic (122) (1,012 (1,235) (2,507 (1,796) Income Tax-Deferred Foreign (277) (5,327) (96) (98) (52) Consolidated Net Income 3,505 5529 (2,181) (2,926) (3,737) Minority Interest Expense 255 913 129 (77) (46) Net Income 3.250 4,616 (2,310) (2,849) (3,691) Net Income Growth -29.59% 299.83% 18.92% 22.81% Net Margin 3.45% Extraordinaries & Discontinued Operations 2,019 Extra Items & Gain/Loss Sale Of Assets 1,887 Discontinued Operations 132 Net Income After Extraordinaries 3,250 4,616 (2,310) (2,849) (5710) LS Net Income Available to Common 3,250 4,616 (2,310) (2,849) (3,559) EPS (Basic) 4.22 6.03 (2.96) (3.70) (243) EPS (Basic) Growth -30.06% 304.02% 20.06% -52.03% Basic Shares Outstanding 744 724 781 770 687 EPS (Diluted) 4.22 6.03 (2.96) (3.70) (2.44) EPS (Diluted) Growth -30.069 304.03% 20.06% -51.57% Diluted Shares Outstanding 767 751 781 770 687 EBITDA 11,991 9,709 8,295 7,013 3,460 EBITDA Growth 23.50% 17.05% 18.28% 102.699 EBITDA Margin 12.71% - EBIT 5,833 3,566 549


