Question: Compute the following ratios for Campbell using the information below Year 11? Liquidity ratios: Asset utilization ratios:* a. Current ratio n. Cash turnover b. Acid-test
Compute the following ratios for Campbell using the information below Year 11?
Liquidity ratios: Asset utilization ratios:*
a. Current ratio n. Cash turnover
b. Acid-test ratio o. Accounts receivable turnover
c. Days to sell inventory p. Inventory turnover
d. Collection period q. Working capital turnover
Capital structure and solvency ratios: r. Fixed assets turnover
e. Total debt to total equity s. Total assets turnover
f. Long-term debt to equity Market measures (Campbell's stock price per share is
g. Times interest earned $46.73 for Year 11):
Return on investment ratios: t. Price-to-earnings ratio
h. Return on total assets u. Earnings yield
i. Return on common equity v. Dividend yield
Operating performance ratios: w. Dividend payout rate
j. Gross profit margin ratio x. Price-to-book ratio
k. Operating profit margin ratio
l. Pretax profit margin ratio
m. Net profit margin ratio
* For simplicity in computing utilization ratios, use end-of-year values and not average values.
![313.4 23.8 4,263.8 668.0 4,316.7 396.4 3,980.3 266.] Campbell Biscuit and Bakery](https://dsd5zvtm8ll6.cloudfront.net/si.experts.images/questions/2024/09/66f68a470eb7c_28666f68a46d16b6.jpg)
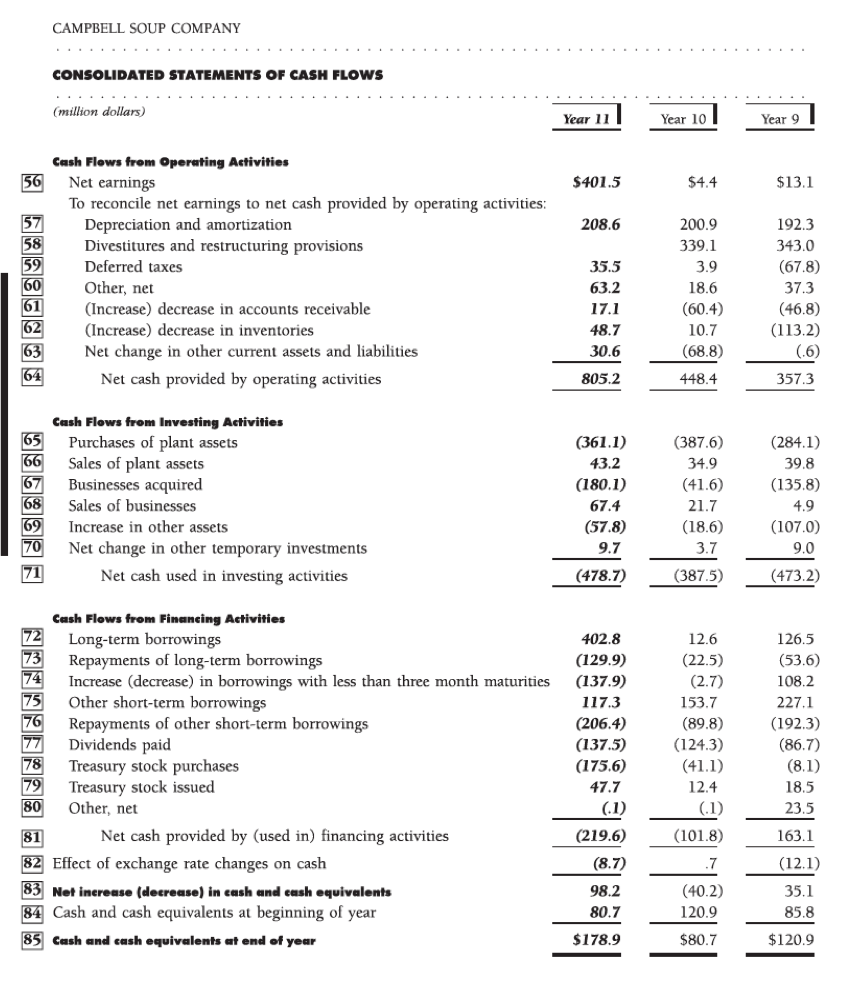
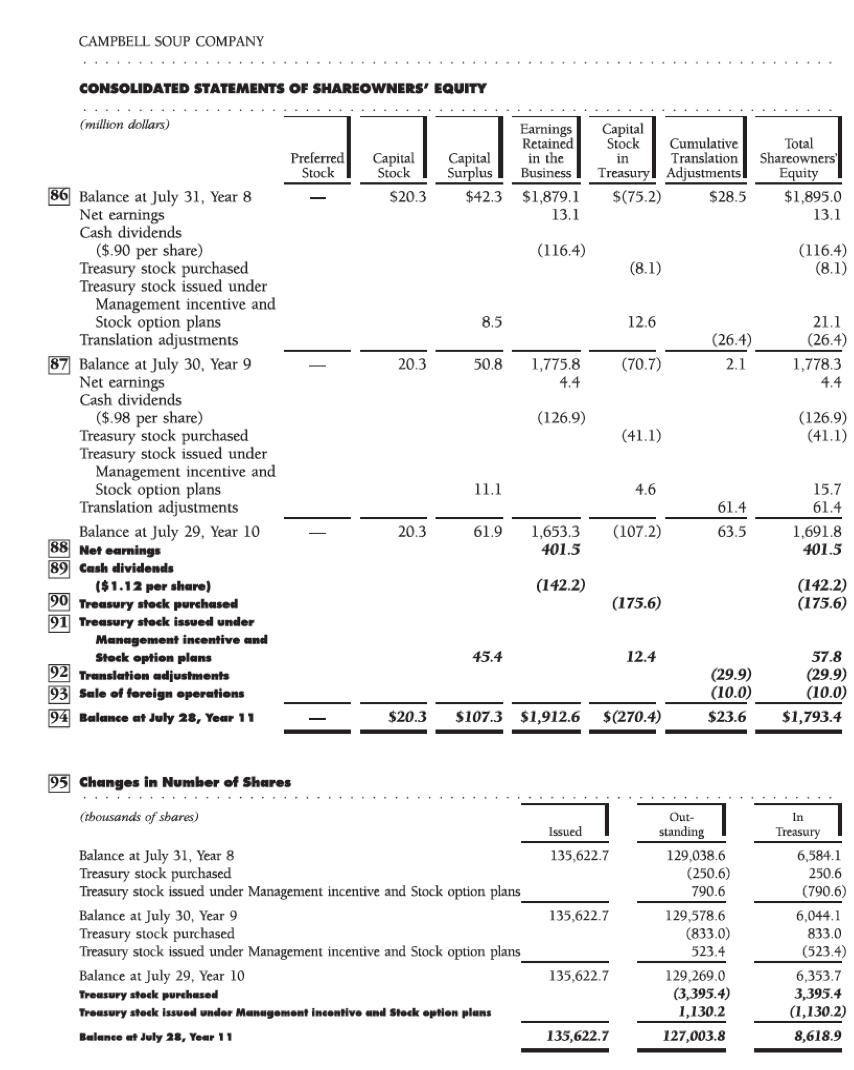
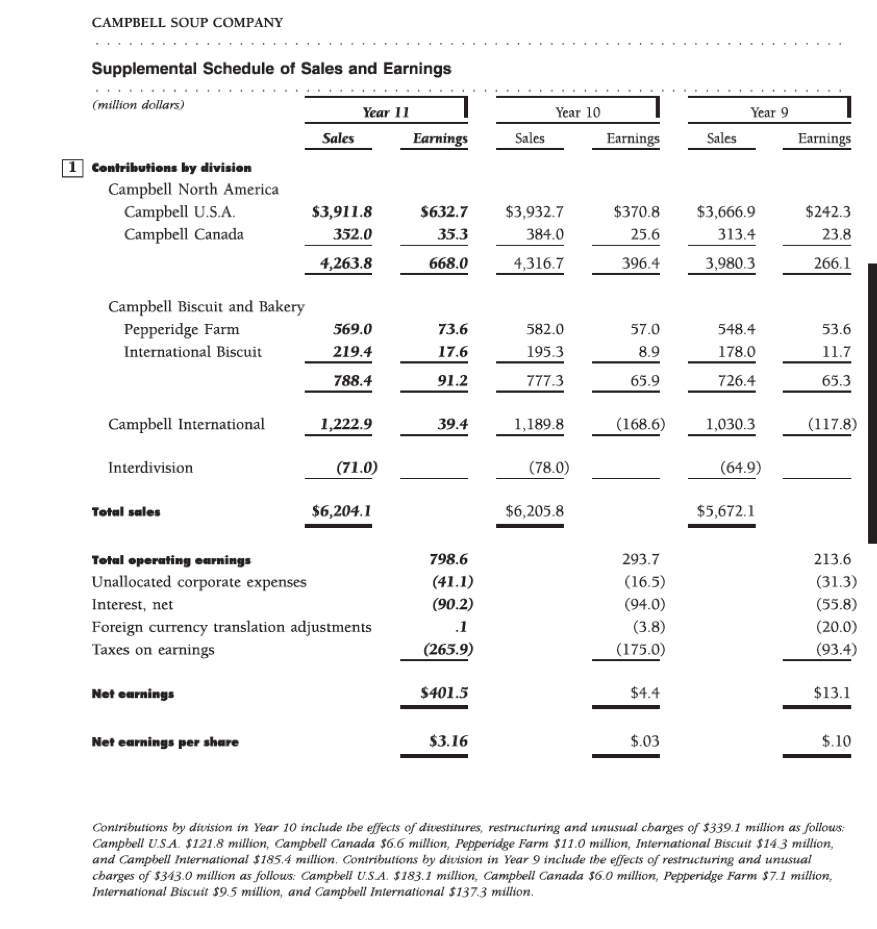
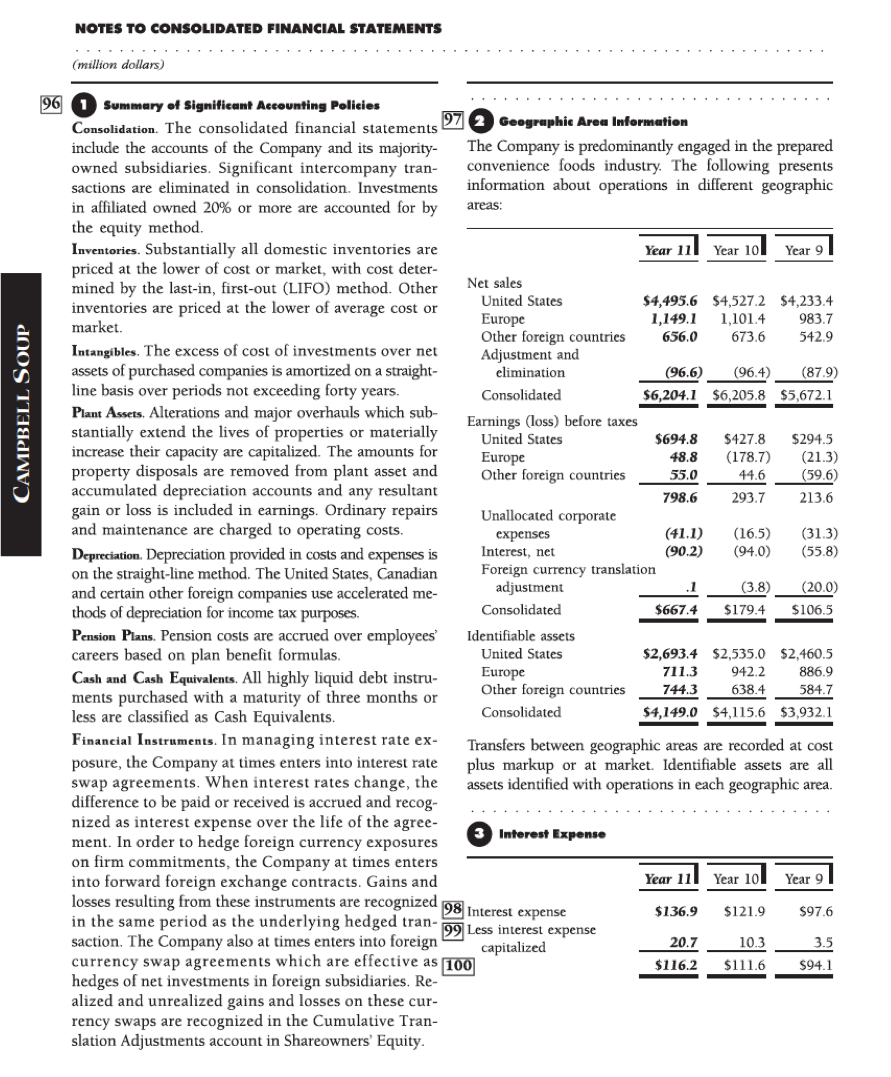
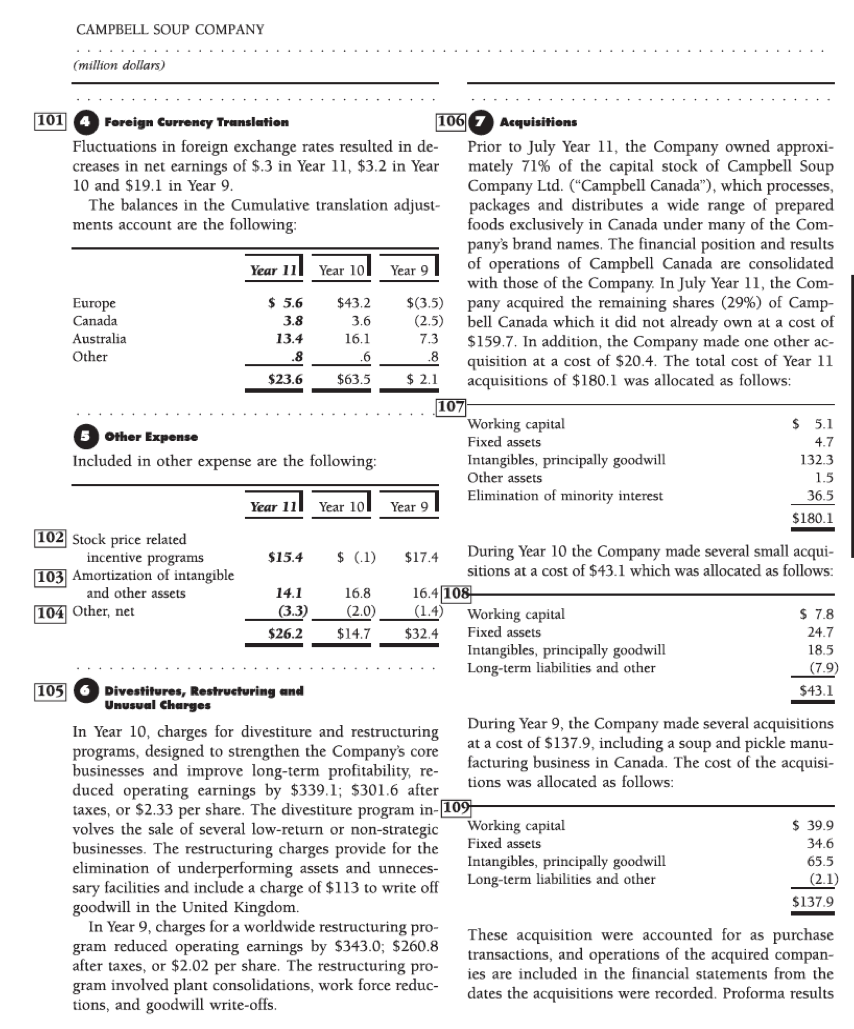
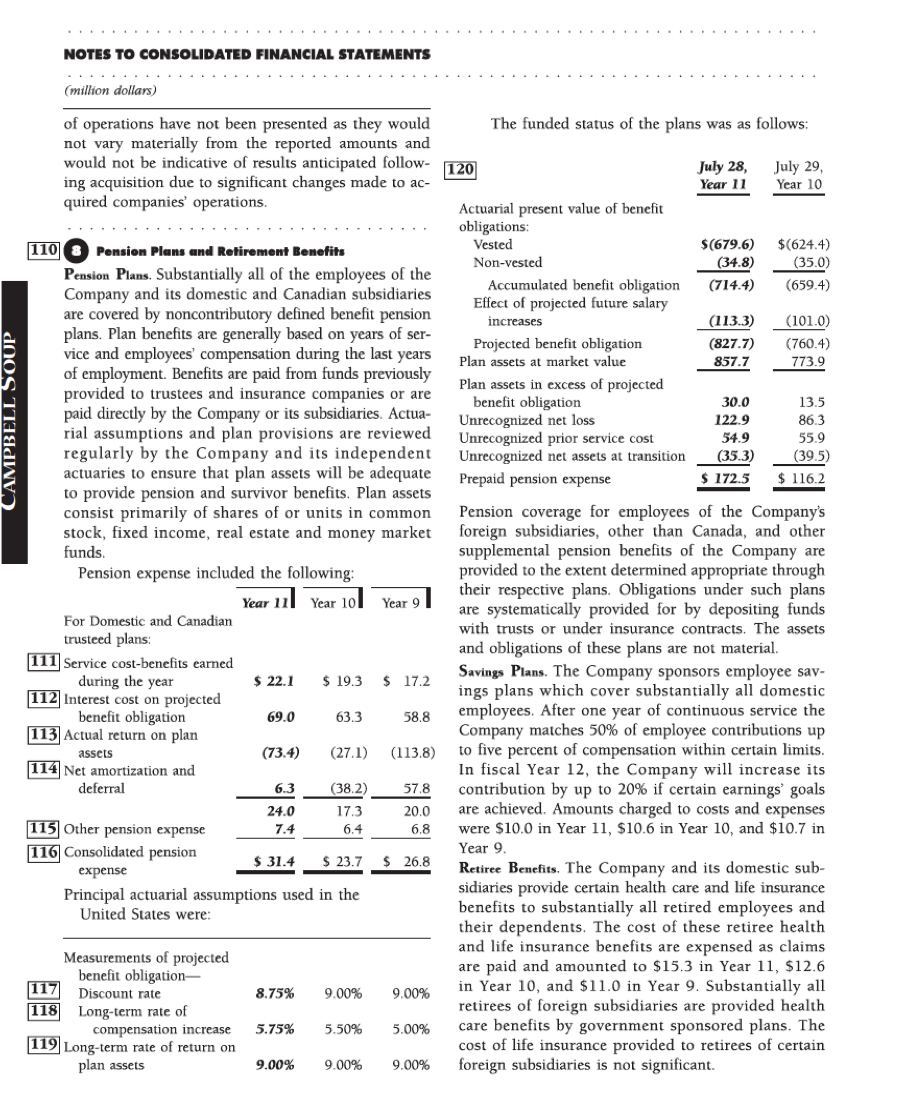
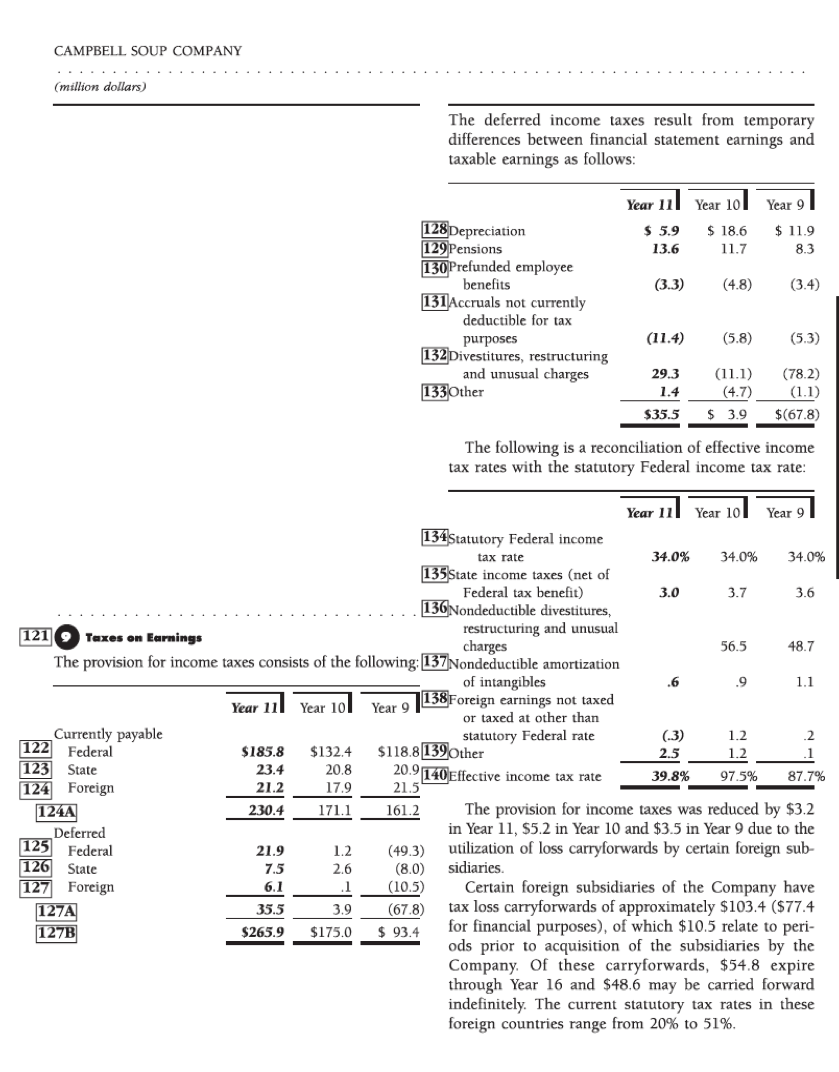
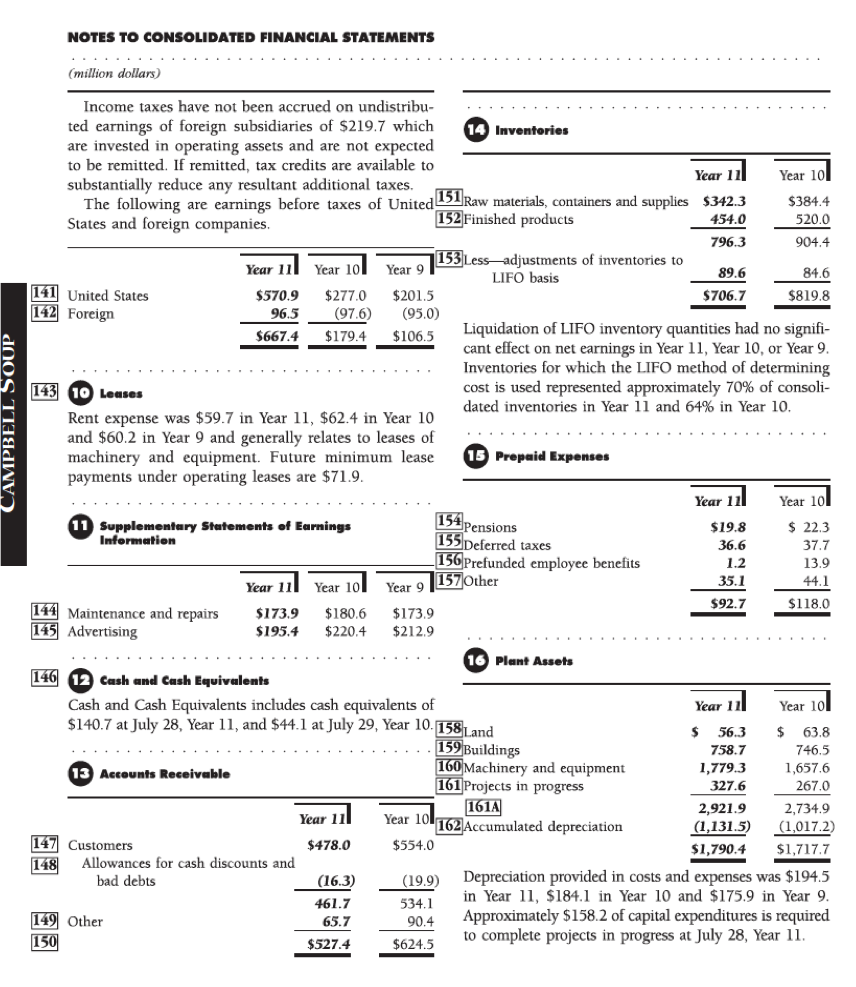
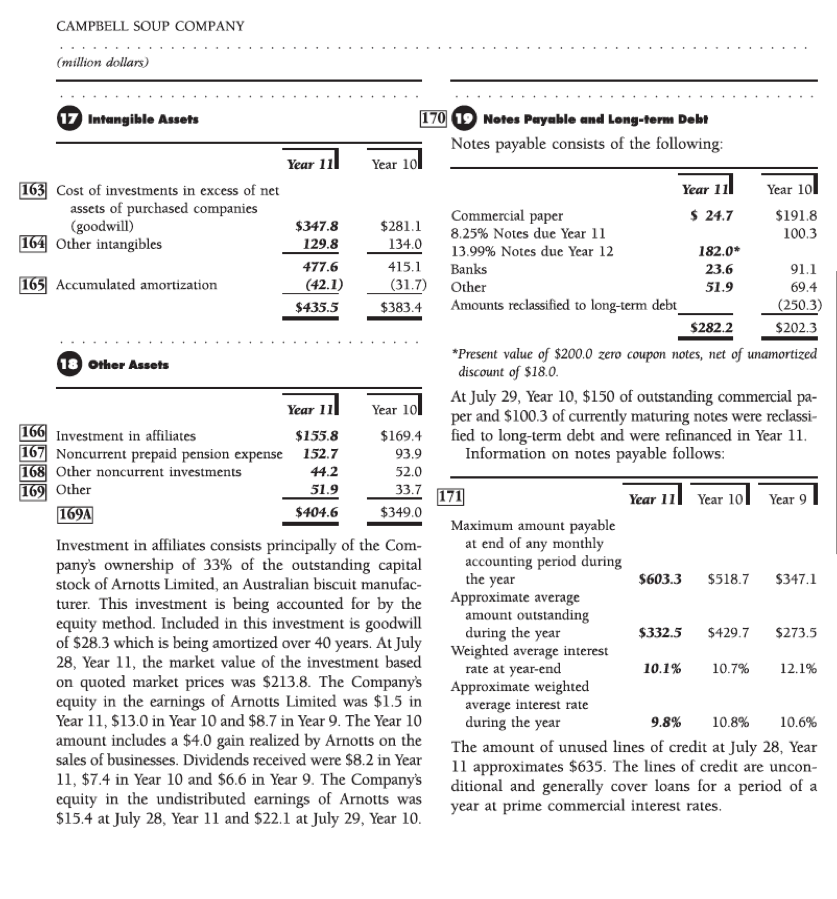
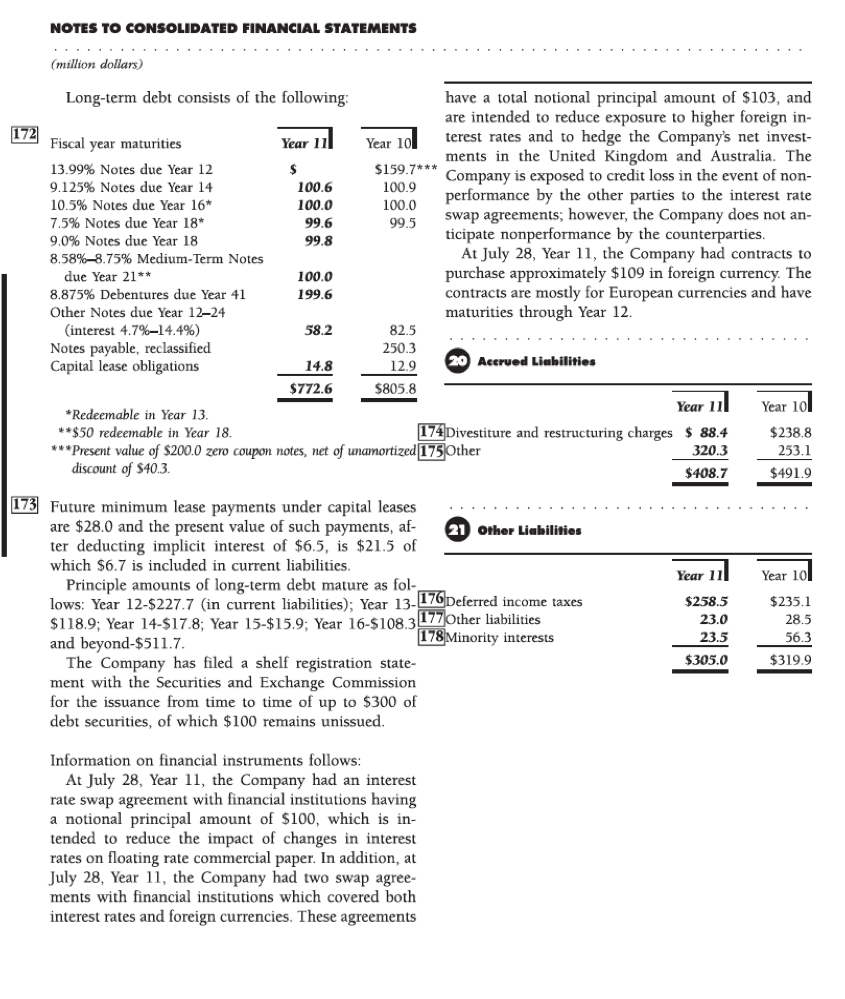
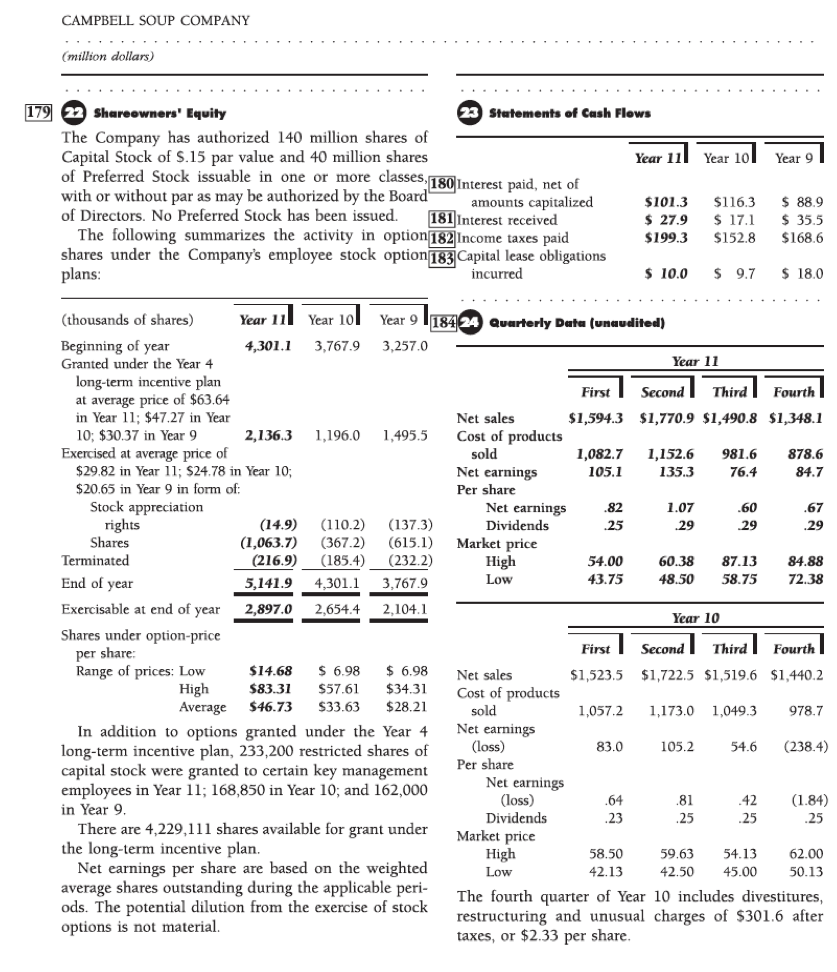
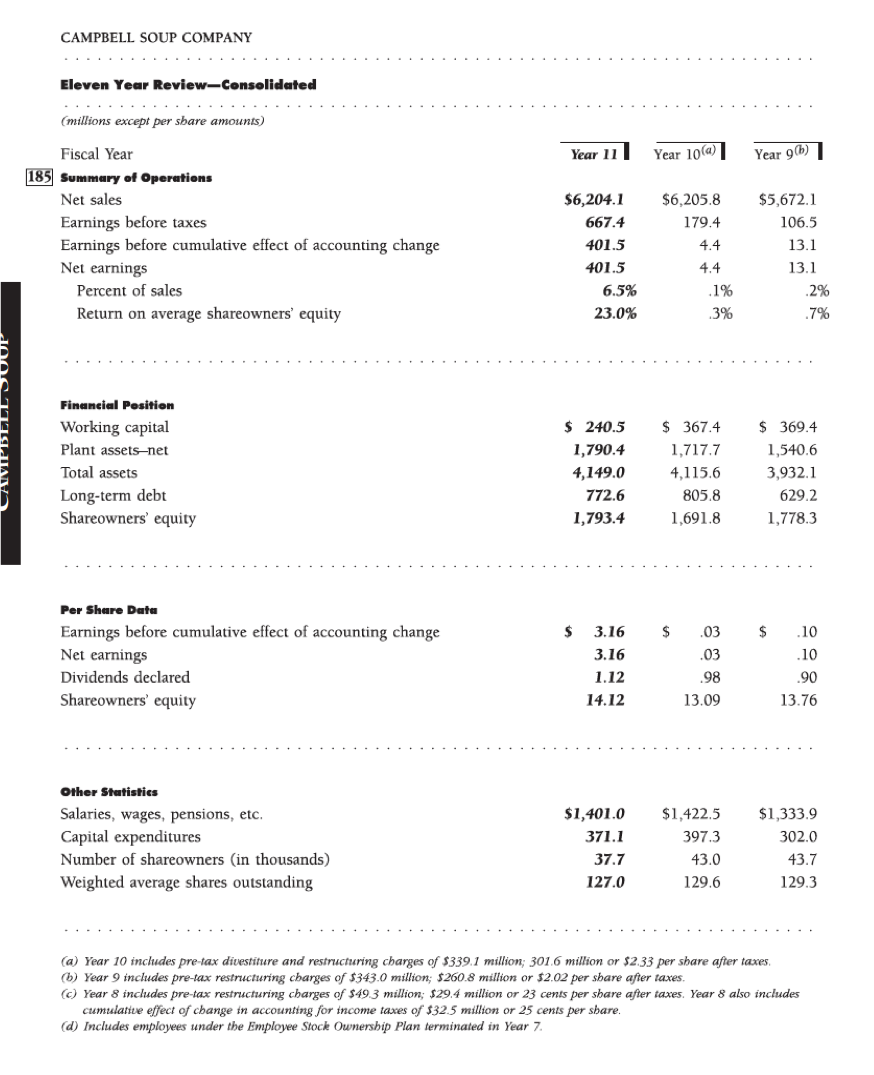
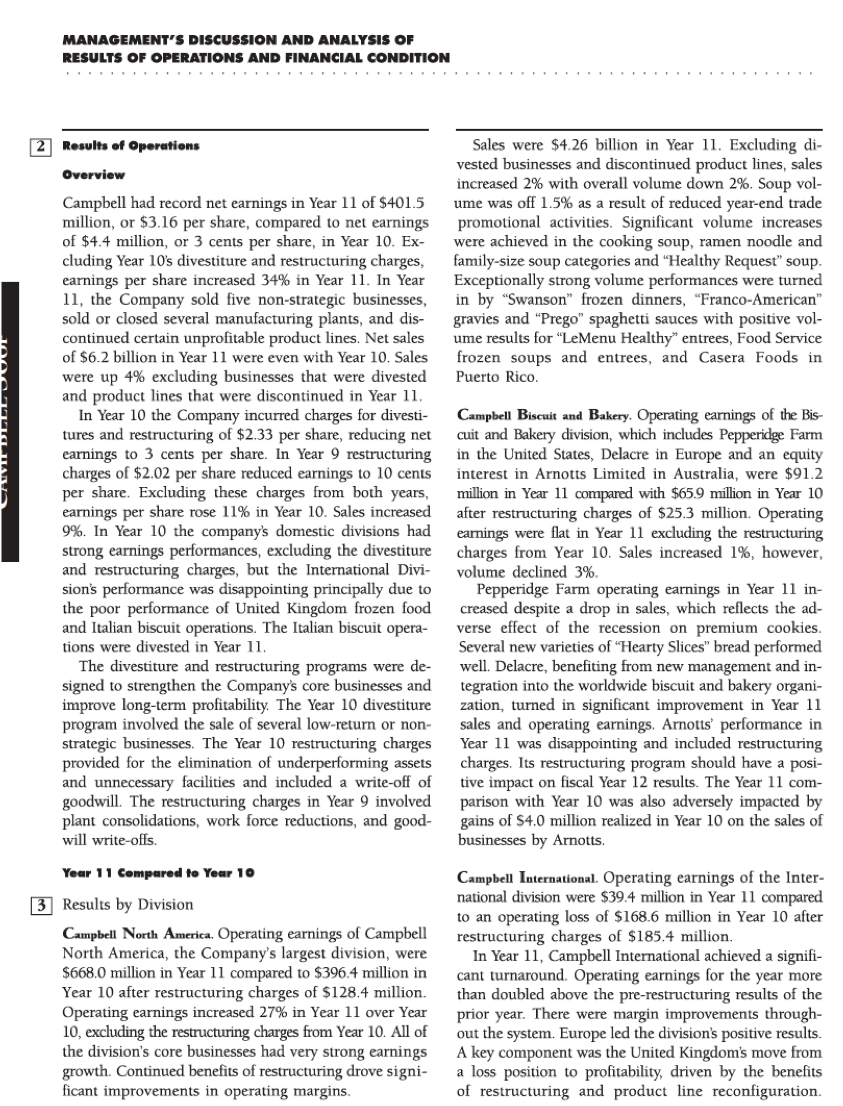
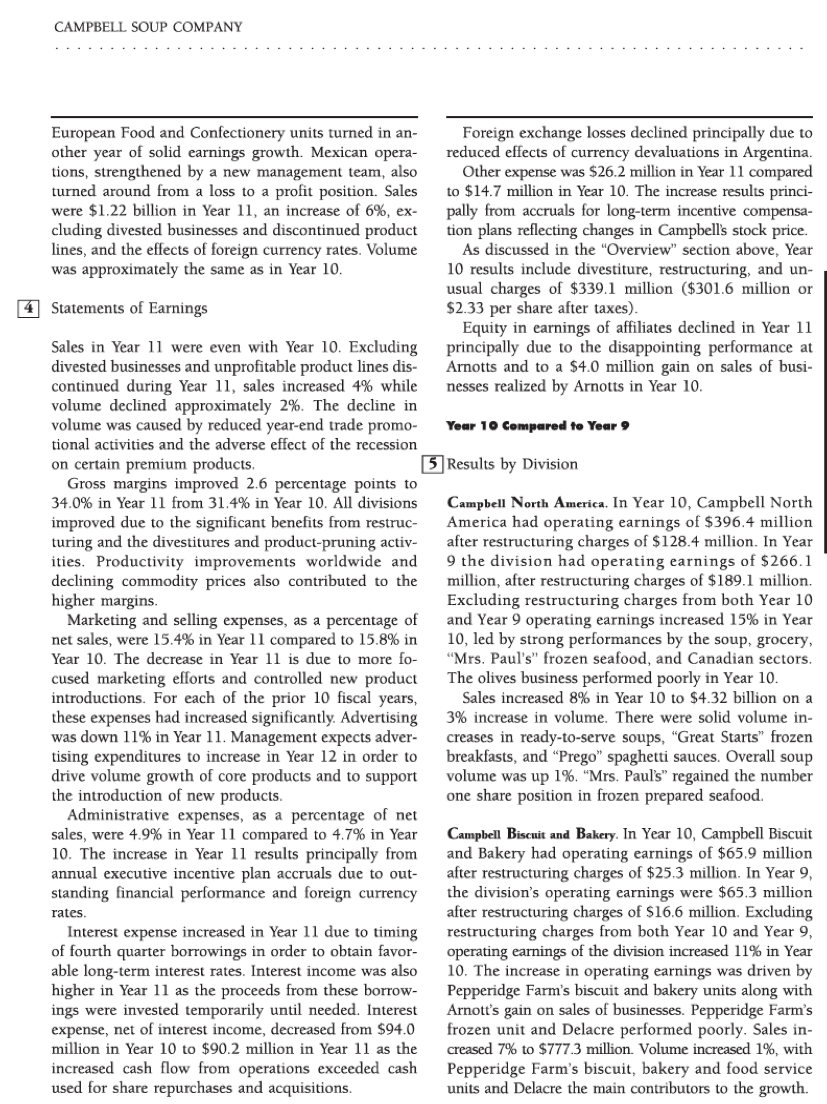
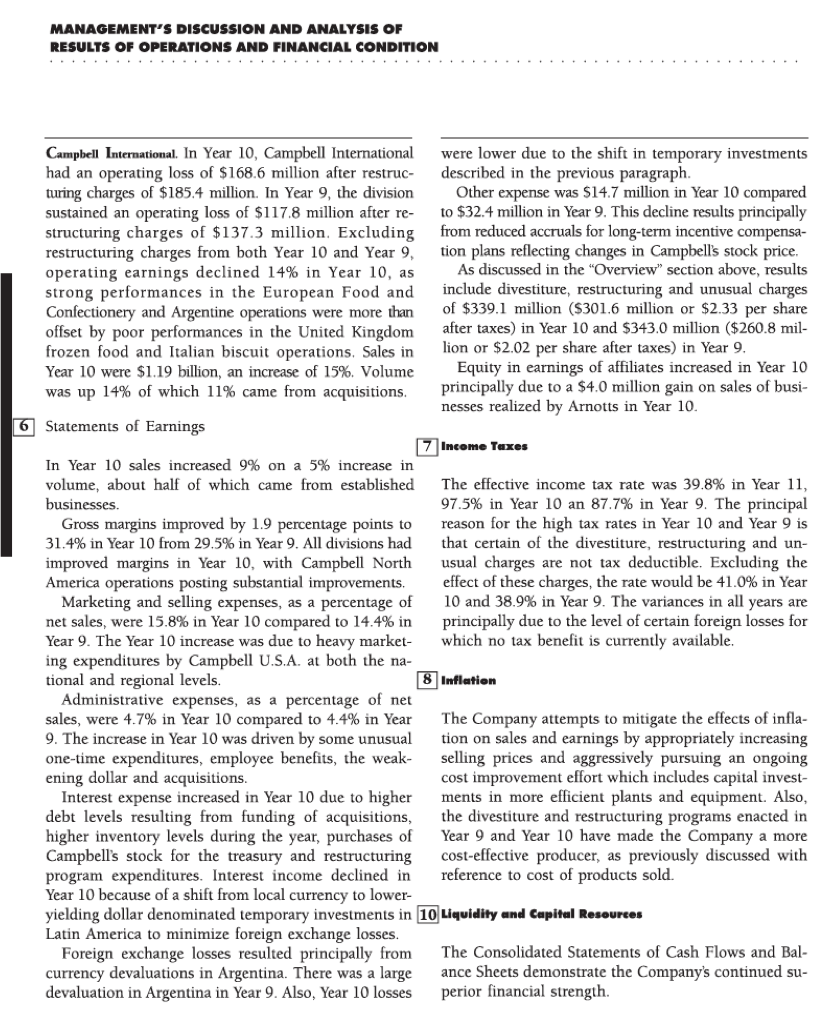
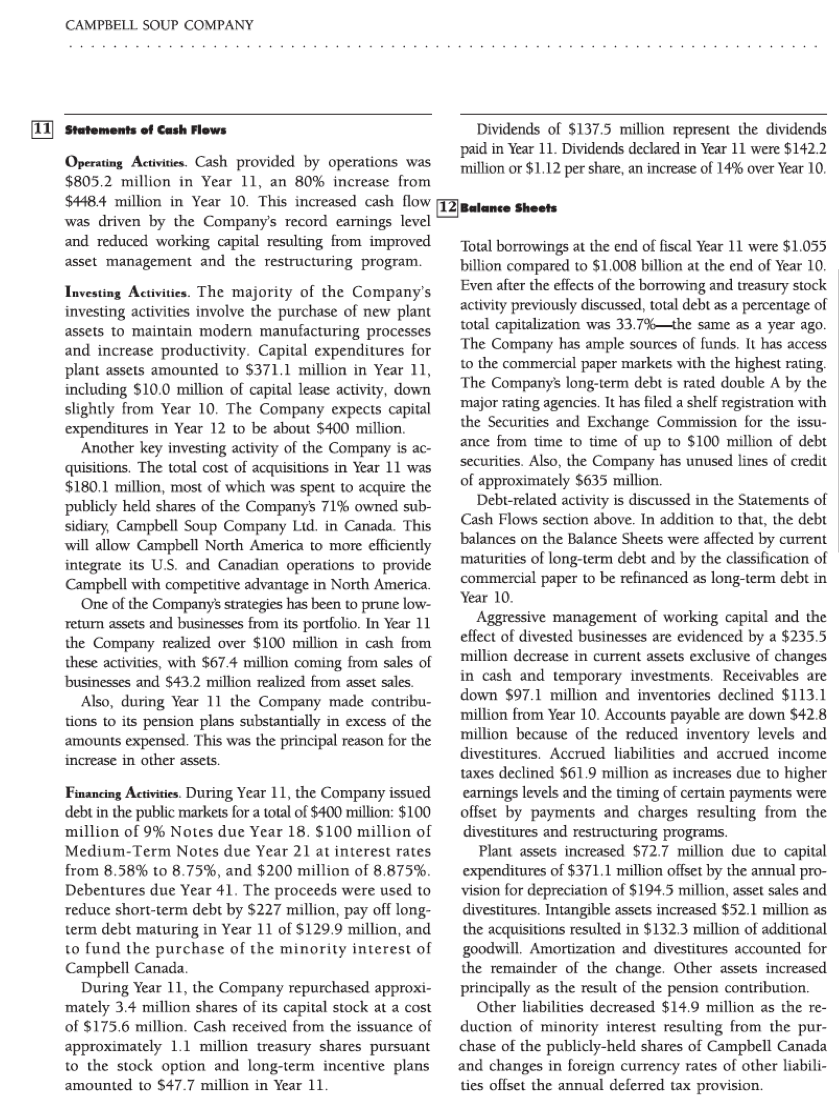
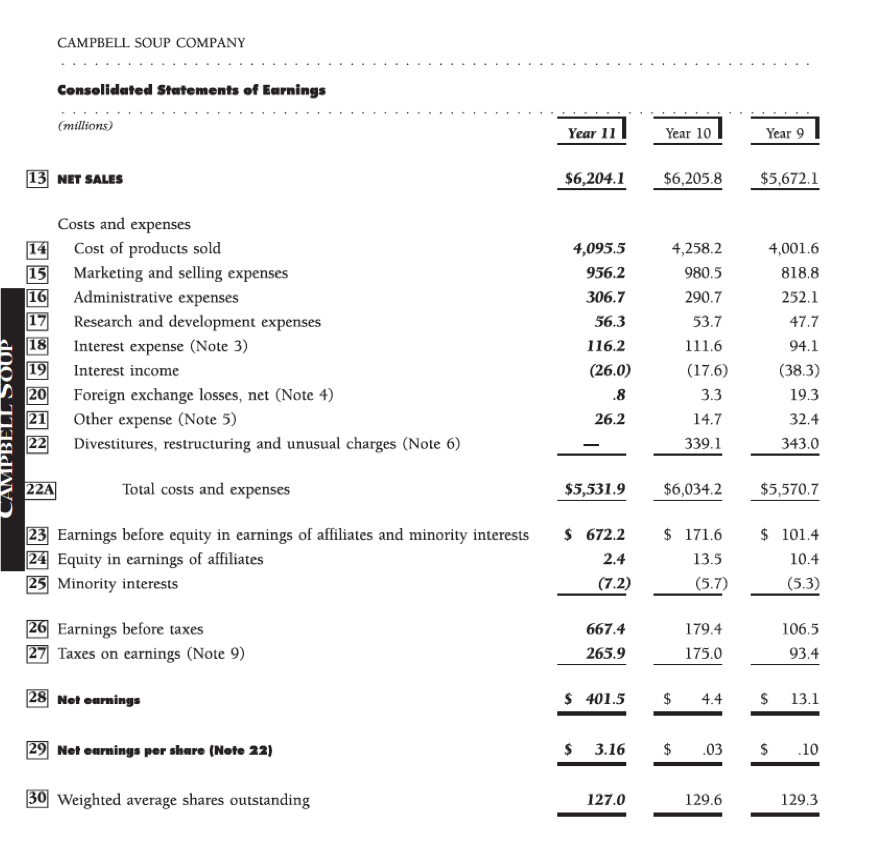
CAMPBELL SOUP COMPANY Supplemental Schedule of Sales and Earnings (million dollars) Year 1I Year 10 Year 9 Sales Earnings Sales Earnings Sales Earnings 1 Contributions by division Campbell North America Campbell U.S.A. $3,911.8 $632.7 $3,932.7 $370.8 $3,666.9 $242.3 Campbell Canada 352.0 35.3 384.0 25.6 313.4 23.8 4,263.8 668.0 4,316.7 396.4 3,980.3 266.] Campbell Biscuit and Bakery Pepperidge Farm 569.0 73.6 582.0 57.0 548.4 53.6 International Biscuit 219.4 17.6 195.3 8.9 178.0 11.7 788.4 91.2 777.3 65.9 726.4 65.3 Campbell International 1,222.9 39.4 1,189.8 (168.6) 1,030.3 (117.8) Interdivision (71.0) (78.0) (64.9) Total sales $6,204.1 $6,205.8 $5,672.1 Total operating earnings 798.6 293.7 213.6 Unallocated corporate expenses (41.1) (16.5) (31.3) Interest, net (90.2) (94.0) (55.8) Foreign currency translation adjustments (3.8) (20.0) Taxes on earnings (265.9) (175.0) (93.4) Net earnings $401.5 $4.4 $13.1 Net earnings per share $3.16 $.03 $.10 Contributions by division in Year 10 include the effects of divestitures, restructuring and unusual charges of $339.1 million as follows; Campbell U.S.A. $121.8 million, Campbell Canada $6.6 million, Pepperidge Farm $11.0 million, International Biscuit $143 million, and Campbell International $185.4 million, Contributions by division in Year 9 include the effects of restructuring and unusual charges of $343.0 million as follows: Campbell U.S.A. $183.1 million, Campbell Canada $6.0 million, Pepperidge Farm $7.1 million, International Biscuit $9.5 million, and Campbell International $137.3 million.NOTES TO CONSOLIDATED FINANCIAL STATEMENTS . . . . . . . (million dollars) 96 1 Summary of Significant Accounting Policies . . . . Consolidation. The consolidated financial statements s 97 2 Geographic Area Information include the accounts of the Company and its majority- The Company is predominantly engaged in the prepared owned subsidiaries. Significant intercompany tran- convenience foods industry. The following presents sactions are eliminated in consolidation. Investments information about operations in different geographic in affiliated owned 20% or more are accounted for by areas: the equity method. Inventories. Substantially all domestic inventories are Year 11 Year 10 Year 9 priced at the lower of cost or market, with cost deter- mined by the last-in, first-out (LIFO) method. Other Net sales inventories are priced at the lower of average cost or United States $4,495.6 $4,527.2 $4,233.4 CAMPBELL SOUP market. Europe 1,149.1 1,101.4 983.7 Intangibles. The excess of cost of investments over net Other foreign countries 656.0 673.6 542.9 Adjustment and assets of purchased companies is amortized on a straight- elimination (96.6) (96.4) (87.9) line basis over periods not exceeding forty years. Consolidated $6,204.1 $6,205.8 $5,672.1 Plant Assets, Alterations and major overhauls which sub- stantially extend the lives of properties or materially Earnings (loss) before taxes increase their capacity are capitalized. The amounts for United States $694.8 $427.8 $294.5 Europe 48.8 (21.3) property disposals are removed from plant asset and (178.7) Other foreign countries 55.0 44.6 (59.6) accumulated depreciation accounts and any resultant gain or loss is included in earnings. Ordinary repairs 798.6 293.7 213.6 and maintenance are charged to operating costs. Unallocated corporate expenses (41.1) (16.5) (31.3) Depreciation. Depreciation provided in costs and expenses is Interest, net (90.2) (94.0) (55.8) on the straight-line method. The United States, Canadian Foreign currency translation and certain other foreign companies use accelerated me- adjustment 3.8) (20.0) thods of depreciation for income tax purposes. Consolidated $667.4 $179.4 $106.5 Pension Plans. Pension costs are accrued over employees' Identifiable assets careers based on plan benefit formulas. United States $2,693.4 $2,535.0 $2,460.5 Cash and Cash Equivalents. All highly liquid debt instru- Europe 711.3 942.2 886.9 ments purchased with a maturity of three months or Other foreign countries 744.3 638.4 584.7 less are classified as Cash Equivalents. Consolidated $4,149.0 $4,115.6 $3,932.1 Financial Instruments. In managing interest rate ex- Transfers between geographic areas are recorded at cost posure, the Company at times enters into interest rate plus markup or at market. Identifiable assets are all swap agreements. When interest rates change, the assets identified with operations in each geographic area. difference to be paid or received is accrued and recog- nized as interest expense over the life of the agree- ment. In order to hedge foreign currency exposures 3 Interest Expense on firm commitments, the Company at times enters into forward foreign exchange contracts. Gains and Year 11 Year 101 Year 9 losses resulting from these instruments are recognized 98 Interest expense in the same period as the underlying hedged tran- $136.9 $121.9 $97.6 saction. The Company also at times enters into foreign 99 Less interest expense 0.3 currency swap agreements which are effective as 100 capitalized 20.7 3.5 $116.2 $111.6 $94.1 hedges of net investments in foreign subsidiaries. Re- alized and unrealized gains and losses on these cur- rency swaps are recognized in the Cumulative Tran- slation Adjustments account in Shareowners' Equity.CAMPBELL SOUP COMPANY . . (million dollars) 101 4 Foreign Currency Translation 106 7 Acquisitions Fluctuations in foreign exchange rates resulted in de- creases in net earnings of $.3 in Year 11, $3.2 in Year Prior to July Year 11, the Company owned approxi- mately 71% of the capital stock of Campbell Soup 10 and $19.1 in Year 9. The balances in the Cumulative translation adjust- Company Lid. ("Campbell Canada"), which processes, packages and distributes a wide range of prepared ments account are the following foods exclusively in Canada under many of the Com- pany's brand names. The financial position and results Year III Year 10 Year 9 of operations of Campbell Canada are consolidated with those of the Company. In July Year 11, the Com- Europe $ 5.6 $43.2 $(3.5) Canada pany acquired the remaining shares (29%) of Camp- 3.8 3.6 (2.5) Australia 13.4 16. 7.3 bell Canada which it did not already own at a cost of Other $159.7. In addition, the Company made one other ac- quisition at a cost of $20.4. The total cost of Year 11 $23.6 $63.5 $ 2.1 acquisitions of $180.1 was allocated as follows: . . . . . . . 107 5 Other Expense Working capital $ 5.1 Fixed assets 47 Included in other expense are the following: Intangibles, principally goodwill 132.3 Other assets 1.5 Year 11 Year 10 Year 9 Elimination of minority interest 36.5 $180.1 102 Stock price related incentive programs $15.4 $ (.1) $17.4 During Year 10 the Company made several small acqui- 103 Amortization of intangible sitions at a cost of $43.1 which was allocated as follows: and other assets 14.1 16.8 16.4 108 104 Other, net 3.3) (2.0 (1.4 Working capital $ 7.8 $26.2 $14.7 $32.4 Fixed assets 24.7 Intangibles, principally goodwill 18.5 Long-term liabilities and other 7.9 105 6 Divestitures, Restructuring and Unusual Charges $43.1 In Year 10, charges for divestiture and restructuring During Year 9, the Company made several acquisitions programs, designed to strengthen the Company's core at a cost of $137.9, including a soup and pickle manu- businesses and improve long-term profitability, re- facturing business in Canada. The cost of the acquisi- duced operating earnings by $339.1; $301.6 after tions was allocated as follows: taxes, or $2.33 per share. The divestiture program in- 109 volves the sale of several low-return or non-strategic Working capital $ 39.9 businesses. The restructuring charges provide for the Fixed assets 34.6 elimination of underperforming assets and unnecess Intangibles, principally goodwill 65.5 sary facilities and include a charge of $113 to write off Long-term liabilities and other (2.1) goodwill in the United Kingdom. $137.9 In Year 9, charges for a worldwide restructuring pro- gram reduced operating earnings by $343.0; $260.8 These acquisition were accounted for as purchase after taxes, or $2.02 per share. The restructuring pro- transactions, and operations of the acquired compan- gram involved plant consolidations, work force reduc- ies are included in the financial statements from the tions, and goodwill write-offs. dates the acquisitions were recorded. Proforma resultsNOTES TO CONSOLIDATED FINANCIAL STATEMENTS . . . . . (million dollars) of operations have not been presented as they would The funded status of the plans was as follows: not vary materially from the reported amounts and would not be indicative of results anticipated follow- 120 July 28, July 29, ing acquisition due to significant changes made to ac- Year 11 Year 10 quired companies' operations. Actuarial present value of benefit obligations: 110 8 Pension Plans and Retirement Benefits Vested $(679.6) $(624.4) Pension Plans. Substantially all of the employees of the Non-vested (34.8) (35.0) Company and its domestic and Canadian subsidiaries Accumulated benefit obligation (714.4) 659.4) are covered by noncontributory defined benefit pension Effect of projected future salary plans. Plan benefits are generally based on years of ser- increases (113.3) (101.0) SOUP vice and employees' compensation during the last years Projected benefit obligation (827.7) (760.4) of employment. Benefits are paid from funds previously Plan assets at market value 857.7 773.9 provided to trustees and insurance companies or are Plan assets in excess of projected paid directly by the Company or its subsidiaries. Actua- benefit obligation 30.0 13.5 CAMPBEL rial assumptions and plan provisions are reviewed Unrecognized net loss 122.9 86.3 regularly by the Company and its independent Unrecognized prior service cost 54.9 55.9 Unrecognized net assets at transition (35.3) 39.5) actuaries to ensure that plan assets will be adequate to provide pension and survivor benefits. Plan assets Prepaid pension expense 172.5 $ 116.2 consist primarily of shares of or units in common Pension coverage for employees of the Company's stock, fixed income, real estate and money market foreign subsidiaries, other than Canada, and other funds. supplemental pension benefits of the Company are Pension expense included the following: provided to the extent determined appropriate through Year 11 Year 10 Year 9 their respective plans. Obligations under such plans For Domestic and Canadian are systematically provided for by depositing funds trusteed plans: with trusts or under insurance contracts. The assets 111 Service cost-benefits earned and obligations of these plans are not material. during the year $ 22.1 $ 19.3 $ 17.2 Savings Plans. The Company sponsors employee sav- 112 Interest cost on projected ings plans which cover substantially all domestic benefit obligation 69.0 63.3 58.8 employees. After one year of continuous service the 113 Actual return on plan Company matches 50% of employee contributions up assets (73.4) (27.1) (113.8) to five percent of compensation within certain limits. 114 Net amortization and In fiscal Year 12, the Company will increase its deferral 6.3 (38.2) 57.8 contribution by up to 20% if certain earnings' goals 24.0 17.3 20.0 are achieved. Amounts charged to costs and expenses 115 Other pension expense 7.4 6.4 6.8 were $10.0 in Year 11, $10.6 in Year 10, and $10.7 in 116 Consolidated pension expense $ 31.4 $ 23.7 26.8 Year 9. Retiree Benefits. The Company and its domestic sub- Principal actuarial assumptions used in the sidiaries provide certain health care and life insurance United States were: benefits to substantially all retired employees and their dependents. The cost of these retiree health Measurements of projected and life insurance benefits are expensed as claims are paid and amounted to $15.3 in Year 11, $12.6 117 benefit obligation- Discount rate 8.75% 9.00% 9.00% in Year 10, and $11.0 in Year 9. Substantially all 118 Long-term rate of retirees of foreign subsidiaries are provided health compensation increase 5.75% 5.50% 5.00% care benefits by government sponsored plans. The 119 Long-term rate of return on cost of life insurance provided to retirees of certain plan assets 9.00% 9.00% 9.00% foreign subsidiaries is not significant.CAMPBELL SOUP COMPANY (million dollars) The deferred income taxes result from temporary differences between financial statement earnings and taxable earnings as follows: Year 11 Year 101 Year 9 128 Depreciation $ 5.9 $ 18.6 $ 11.9 129 Pensions 13.6 11.7 8.3 130 Prefunded employee benefits (3.3) (4.8) (3.4) 131 Accruals not currently deductible for tax purposes (11.4) (5.8) (5.3) 132 Divestitures, restructuring and unusual charges 29.3 (11.1) (78.2) 133 Other 1.4 (4.7) (1.1) $35.5 $ 3.9 $(67.8) The following is a reconciliation of effective income tax rates with the statutory Federal income tax rate: Year 11 Year 10 Year 9 134Statutory Federal income tax rate 34.0% 34.0% 34.0% 135 State income taxes (net of Federal tax benefit) 3.0 3.7 3.6 . . . 136Nondeductible divestitures, 121 9 Taxes on Earnings restructuring and unusual charges 56.5 48.7 The provision for income taxes consists of the following: 137 Nondeductible amortization of intangibles 1.1 Year 11 Year 101 Year 9 138 Foreign earnings not taxed or taxed at other than Currently payable (.3) 1.2 122 Federal $185.8 $132.4 $118.8 139Other statutory Federal rate 2.5 123 State 23.4 20.8 124 Foreign 21.2 17.9 20.9 140 Effective income tax rate 21.5 39.8% )7.5% 87.7% 124A 230.4 171.1 161.2 The provision for income taxes was reduced by $3.2 125 Deferred in Year 11, $5.2 in Year 10 and $3.5 in Year 9 due to the Federal 21.9 1.2 (49.3) utilization of loss carryforwards by certain foreign sub- 126 State 7.5 2.6 (8.0) sidiaries. 127 Foreign 6.1 (10.5) Certain foreign subsidiaries of the Company have 127A 35.5 3.9 (67.8) tax loss carryforwards of approximately $103.4 ($77.4 127B $265.9 $175.0 $ 93.4 for financial purposes), of which $10.5 relate to peri- ods prior to acquisition of the subsidiaries by the Company. Of these carryforwards, $54.8 expire through Year 16 and $48.6 may be carried forward indefinitely. The current statutory tax rates in these foreign countries range from 20% to 51%.NOTES TO CONSOLIDATED FINANCIAL STATEMENTS . . . . . . . . . . . (million dollars) Income taxes have not been accrued on undistribu- ted earnings of foreign subsidiaries of $219.7 which 14 Inventories are invested in operating assets and are not expected to be remitted. If remitted, tax credits are available to substantially reduce any resultant additional taxes. Year III Year 10 The following are earnings before taxes of United Raw materials, containers and supplies $342.3 $384.4 States and foreign companies. 152 Finished products 454.0 520.0 796.3 904.4 Year 11 Year 101 Year 9 5Less-adjustments of inventories to LIFO basis 89.6 84.6 141 United States $570.9 $277.0 $201.5 $706.7 $819.8 142 Foreign 96.5 (97.6) (95.0) $667.4 $179.4 $106.5 Liquidation of LIFO inventory quantities had no signifi- cant effect on net earnings in Year 11, Year 10, or Year 9. Inventories for which the LIFO method of determining 143 10 Leases cost is used represented approximately 70% of consoli- Rent expense was $59.7 in Year 11, $62.4 in Year 10 dated inventories in Year 11 and 64% in Year 10. and $60.2 in Year 9 and generally relates to leases of . . . machinery and equipment. Future minimum lease Prepaid Expenses payments under operating leases are $71.9. Year 11 Year 10 11 Supplementary Statements of Earnings Information 154 Pensions 155 Deferred taxes $19.8 $ 22.3 36.6 37.7 156 Prefunded employee benefits 1.2 13.9 Year 11 Year 10 Year 9 |157 Other 35.1 44.1 144 Maintenance and repairs $173.9 $180.6 $173.9 $92.7 $118.0 145 Advertising $195.4 $220.4 $212.9 16 Plant Assets 146 12 Cash and Cash Equivalents Cash and Cash Equivalents includes cash equivalents of Year 11 Year 101 $140.7 at July 28, Year 11, and $44.1 at July 29, Year 10. 158 Land 56.3 $ 63.8 159 Buildings 758.7 746.5 13 Accounts Receivable 160 Machinery and equipment 1,779.3 1,657.6 161 Projects in progress 327.6 267.0 Year 11l Year 10 161A 2,921.9 2,734.9 162 Accumulated depreciation (1,131.5) (1,017.2) 147 Customers $478.0 $554.0 148 Allowances for cash discounts and $1,790.4 $1,717.7 bad debts (16.3) (19.9) Depreciation provided in costs and expenses was $194.5 461.7 534.1 in Year 11, $184.1 in Year 10 and $175.9 in Year 9 149 Other $5.7 90.4 Approximately $158.2 of capital expenditures is required 150 $527.4 $624.5 to complete projects in progress at July 28, Year 11.CAMPBELL SOUP COMPANY (million dollars) 17 Intangible Assets 170 19 Notes Payable and Long-term Debt Year 11l Year 10 Notes payable consists of the following: 163 Cost of investments in excess of net Year 11l Year 10 assets of purchased companies (goodwill) $347.8 $281.1 Commercial paper $ 24.7 $191.8 164 Other intangibles 129.8 134.0 8.25% Notes due Year 11 100.3 13.99% Notes due Year 12 182.0* $77.6 +15.1 Banks 23.6 91.1 165 Accumulated amortization (42.1) :31.7) Other 51.9 69.4 $435.5 $383.4 Amounts reclassified to long-term debt (250.3) $282.2 $202.3 18 Other Assets "Present value of $200.0 zero coupon notes, net of unamortized discount of $18.0. Year 11 Year 10 At July 29, Year 10, $150 of outstanding commercial pa- per and $100.3 of currently maturing notes were reclassi- 166 Investment in affiliates $155.8 $169.4 fied to long-term debt and were refinanced in Year 11. 167 Noncurrent prepaid pension expense 152.7 93.9 Information on notes payable follows: 168 Other noncurrent investments 44.2 52.0 169 Other 51.9 33.7 169A $404.6 $349.0 171 Year 11l Year 10 Year 9 Maximum amount payable Investment in affiliates consists principally of the Com- at end of any monthly pany's ownership of 33% of the outstanding capital accounting period during stock of Arnotts Limited, an Australian biscuit manufac the year $603.3 $518.7 $347.1 turer. This investment is being accounted for by the Approximate average equity method. Included in this investment is goodwill amount outstanding of $28.3 which is being amortized over 40 years. At July during the year $332.5 $429.7 $273.5 28, Year 11, the market value of the investment based Weighted average interest on quoted market prices was $213.8. The Company's rate at year-end 10.1% 10.7% 12.1% equity in the earnings of Arnotts Limited was $1.5 in Approximate weighted Year 11, $13.0 in Year 10 and $8.7 in Year 9. The Year 10 average interest rate during the year 9.8% 10.8% 10.6% amount includes a $4.0 gain realized by Arnotts on the sales of businesses. Dividends received were $8.2 in Year The amount of unused lines of credit at July 28, Year 11, $7.4 in Year 10 and $6.6 in Year 9. The Company's 11 approximates $635. The lines of credit are uncon- equity in the undistributed earnings of Arnotts was ditional and generally cover loans for a period of a $15.4 at July 28, Year 11 and $22.1 at July 29, Year 10. year at prime commercial interest rates.NOTES TO CONSOLIDATED FINANCIAL STATEMENTS (million dollars) Long-term debt consists of the following: have a total notional principal amount of $103, and 172 are intended to reduce exposure to higher foreign in- Fiscal year maturities Year Ill Year 10 terest rates and to hedge the Company's net invest- 13.99% Notes due Year 12 S $159.7* *# ments in the United Kingdom and Australia. The 9.125% Notes due Year 14 100.6 100.9 Company is exposed to credit loss in the event of non- 10.5% Notes due Year 16* 100.0 100.0 performance by the other parties to the interest rate 7.5% Notes due Year 18* 99.6 99.5 swap agreements; however, the Company does not an- 9.0% Notes due Year 18 99.8 ticipate nonperformance by the counterparties. 8.58%-8.75% Medium-Term Notes At July 28, Year 11, the Company had contracts to due Year 21** 100.0 purchase approximately $109 in foreign currency. The 8.875% Debentures due Year 41 199.6 contracts are mostly for European currencies and have Other Notes due Year 12-24 maturities through Year 12. (interest 4.7%-14.4%) 58.2 82.5 Notes payable, reclassified 250.3 Capital lease obligations 14.8 12.9 20 Accrued Liabilities $772.6 5805.8 *Redeemable in Year 13. Year Ill Year 101 **$50 redeemable in Year 18. $238.8 *"Present value of $200.0 zero coupon notes, net of unamortized 175 Other 174 Divestiture and restructuring charges $ 88.4 320.3 253.1 discount of $40.3. $408.7 $491.9 173 Future minimum lease payments under capital leases are $28.0 and the present value of such payments, af- ter deducting implicit interest of $6.5, is $21.5 of 21 Other Liabilities which $6.7 is included in current liabilities. Principle amounts of long-term debt mature as fol- Year 11 Year 101 lows: Year 12-$227.7 (in current liabilities); Year 13-176 Deferred income taxes $258.5 $235.1 $118.9; Year 14-$17.8; Year 15-$15.9; Year 16-$108.3 177Other liabilities 23.0 28.5 and beyond-$511.7. 178 Minority interests 23.5 56.3 The Company has filed a shelf registration state- $305.0 $319.9 ment with the Securities and Exchange Commission for the issuance from time to time of up to $300 of debt securities, of which $100 remains unissued. Information on financial instruments follows: At July 28, Year 11, the Company had an interest rate swap agreement with financial institutions having a notional principal amount of $100, which is in- tended to reduce the impact of changes in interest rates on floating rate commercial paper. In addition, at July 28, Year 11, the Company had two swap agree- ments with financial institutions which covered both interest rates and foreign currencies. These agreementsCAMPBELL SOUP COMPANY (million dollars) . . . . 179 22 Shareowners' Equity 23 Statements of Cash Flows The Company has authorized 140 million shares of Capital Stock of S.15 par value and 40 million shares Year 11l Year 101 Year 9 of Preferred Stock issuable in one or more classes, 180 Interest paid, net of with or without par as may be authorized by the Board $101.3 $ 88.9 of Directors. No Preferred Stock has been issued. amounts capitalized $116.3 181 Interest received $ 27.9 $ 17.1 $ 35.5 The following summarizes the activity in option 182 Income taxes paid $199.3 $152.8 $168.6 shares under the Company's employee stock option 183 Capital lease obligations plans: incurred $ 10.0 $ 9.7 $ 18.0 (thousands of shares) Year 11 Year 101 Year 9 184 24 Quarterly Data (unaudited) Beginning of year 4,301.1 3,767.9 3,257.0 Granted under the Year 4 Year 11 long-term incentive plan at average price of $63.64 First Second Third | Fourth in Year 11; $47.27 in Year Net sales $1,594.3 $1,770.9 $1,490.8 $1,348.1 10; $30.37 in Year 9 2,136.3 1,196.0 1,495.5 Cost of products Exercised at average price of sold 1,082.7 1,152.6 981.6 878.6 $29.82 in Year 11; $24,78 in Year 10; Net earnings 105.1 135.3 76.4 84.7 $20.65 in Year 9 in form of; Per share Stock appreciation Net earnings 82 1.07 60 67 rights (14.9) (110.2) (137.3) Dividends 25 .29 29 .29 Shares (1,063.7) (367.2) (615.1) Market price Terminated (216.9) (185.4) (232.2) High 54.00 60.38 87.13 84.88 End of year 5,141.9 4,301.1 3,767.9 Low 43.75 48.50 58.75 72.38 Exercisable at end of year 2,897.0 2,654.4 2,104.1 Year 10 Shares under option-price per share: First | Second Third | Fourth Range of prices; Low $14.68 $ 6.98 $ 6.98 $34.31 Net sales $1,523.5 $1,722.5 $1,519.6 $1,440.2 High $83.31 $57.61 Average $33.63 $28.21 Cost of products $46.73 sold 1,057.2 1,173.0 1,049.3 978.7 In addition to options granted under the Year 4 Net earnings long-term incentive plan, 233,200 restricted shares of (loss) 83.0 105.2 54.6 (238.4) capital stock were granted to certain key management Per share employees in Year 11; 168,850 in Year 10; and 162,000 Net earnings in Year 9. (loss) 64 .81 .23 42 (1.84) There are 4,229,111 shares available for grant under Dividends .25 .25 .25 the long-term incentive plan. Market price High 58.50 59.63 54.13 62.00 Net earnings per share are based on the weighted Low 42.13 42.50 45.00 50.13 average shares outstanding during the applicable peri- ods. The potential dilution from the exercise of stock The fourth quarter of Year 10 includes divestitures, options is not material. restructuring and unusual charges of $301.6 after taxes, or $2.33 per share.CAMPBELL SOUP COMPANY Eleven Year Review-Consolidated (millions except per share amounts) Fiscal Year Year 11 Year 10(@) Year 9(b) 185 Summary of Operations Net sales $6,204.1 $6,205.8 $5,672.1 Earnings before taxes 667.4 179.4 106.5 Earnings before cumulative effect of accounting change 401.5 4.4 13.1 Net earnings 401.5 4.4 13.1 Percent of sales 6.5% .1% 2% Return on average shareowners' equity 23.0% 3% .7% Financial Position Working capital $ 240.5 $ 367.4 $ 369.4 Plant assets-net 1,790.4 1,717.7 1,540.6 Total assets 4,149.0 4,115.6 3,932.1 Long-term debt 772.6 805.8 629.2 Shareowners' equity 1,793.4 1,691.8 1,778.3 Per Share Data Earnings before cumulative effect of accounting change 3.16 $ .03 10 Net earnings 3.16 .03 .10 Dividends declared 1.12 98 90 Shareowners' equity 14.12 13.09 13.76 Other Statistics Salaries, wages, pensions, etc. $1,401.0 $1,422.5 $1,333.9 Capital expenditures 371.1 397.3 302.0 Number of shareowners (in thousands) 37.7 43.0 43.7 Weighted average shares outstanding 127.0 129.6 129.3 (a) Year 10 includes pre-tax divestiture and restructuring charges of $339.1 million; 301.6 million or $2.33 per share after taxes. (b) Year 9 includes pre-tax restructuring charges of $343.0 million; $260.8 million or $2.02 per share after taxes. "c) Year 8 includes pre-tax restructuring charges of $49.3 million; $29.4 million or 23 cents per share after taxes. Year 8 also includes cumulative effect of change in accounting for income taxes of $32.5 million or 25 cents per share. (d) Includes employees under the Employee Stock Ownership Plan terminated in Year 7.MANAGEMENT'S DISCUSSION AND ANALYSIS OF RESULTS OF OPERATIONS AND FINANCIAL CONDITION 2 Results of Operations Sales were $4.26 billion in Year 11. Excluding di- Overview vested businesses and discontinued product lines, sales Campbell had record net earnings in Year 11 of $401.5 increased 2% with overall volume down 2%. Soup vol- ume was off 1.5% as a result of reduced year-end trade million, or $3.16 per share, compared to net earnings promotional activities. Significant volume increases of $4.4 million, or 3 cents per share, in Year 10. Ex- were achieved in the cooking soup, ramen noodle and cluding Year 10's divestiture and restructuring charges, family-size soup categories and "Healthy Request" soup. earnings per share increased 34% in Year 11. In Year 11, the Company sold five non-strategic businesses, Exceptionally strong volume performances were turned sold or closed several manufacturing plants, and dis- in by "Swanson" frozen dinners, "Franco-American" gravies and "Prego" spaghetti sauces with positive vol- continued certain unprofitable product lines. Net sales ume results for "LeMenu Healthy" entrees, Food Service of $6.2 billion in Year 11 were even with Year 10. Sales frozen soups and entrees, and Casera Foods in were up 4% excluding businesses that were divested Puerto Rico. and product lines that were discontinued in Year 11. In Year 10 the Company incurred charges for divesti- Campbell Biscuit and Bakery, Operating earnings of the Bis- tures and restructuring of $2.33 per share, reducing net cuit and Bakery division, which includes Pepperidge Farm earnings to 3 cents per share. In Year 9 restructuring in the United States, Delacre in Europe and an equity charges of $2.02 per share reduced earnings to 10 cents interest in Arnotts Limited in Australia, were $91.2 per share. Excluding these charges from both years, million in Year 11 compared with $65.9 million in Year 10 earnings per share rose 11% in Year 10. Sales increased 9%. In Year 10 the company's domestic divisions had after restructuring charges of $25.3 million. Operating strong earnings performances, excluding the divestiture earnings were flat in Year 11 excluding the restructuring and restructuring charges, but the International Divi- charges from Year 10. Sales increased 1%, however, sion's performance was disappointing principally due to volume declined 3%. the poor performance of United Kingdom frozen food Pepperidge Farm operating earnings in Year 11 in- creased despite a drop in sales, which reflects the ad- and Italian biscuit operations. The Italian biscuit opera- verse effect of the recession on premium cookies. tions were divested in Year 11. Several new varieties of "Hearty Slices" bread performed The divestiture and restructuring programs were de- well. Delacre, benefiting from new management and in- signed to strengthen the Company's core businesses and tegration into the worldwide biscuit and bakery organi- improve long-term profitability. The Year 10 divestiture zation, turned in significant improvement in Year 11 program involved the sale of several low-return or non- sales and operating earnings. Arnotts' performance in strategic businesses. The Year 10 restructuring charges Year 11 was disappointing and included restructuring provided for the elimination of underperforming assets and unnecessary facilities and included a write-off of charges. Its restructuring program should have a posi- goodwill. The restructuring charges in Year 9 involved tive impact on fiscal Year 12 results. The Year 11 com- plant consolidations, work force reductions, and good- parison with Year 10 was also adversely impacted by gains of $4.0 million realized in Year 10 on the sales of will write-offs. businesses by Arnotts. Year 1 1 Compared to Year 10 Campbell International. Operating earnings of the Inter- 3 Results by Division national division were $39.4 million in Year 11 compared Campbell North America. Operating earnings of Campbell to an operating loss of $168.6 million in Year 10 after North America, the Company's largest division, were restructuring charges of $185.4 million. $668.0 million in Year 11 compared to $396.4 million in In Year 11, Campbell International achieved a signifi- Year 10 after restructuring charges of $128.4 million. cant turnaround. Operating earnings for the year more Operating earnings increased 27% in Year 11 over Year than doubled above the pre-restructuring results of the 10, excluding the restructuring charges from Year 10. All of prior year. There were margin improvements through- out the system. Europe led the division's positive results. the division's core businesses had very strong earnings A key component was the United Kingdom's move from growth. Continued benefits of restructuring drove signi- a loss position to profitability, driven by the benefits ficant improvements in operating margins. of restructuring and product line reconfiguration.CAMPBELL SOUP COMPANY European Food and Confectionery units turned in an- Foreign exchange losses declined principally due to other year of solid earnings growth. Mexican opera- reduced effects of currency devaluations in Argentina. tions, strengthened by a new management team, also Other expense was $26.2 million in Year 11 compared turned around from a loss to a profit position. Sales to $14.7 million in Year 10. The increase results princi- were $1.22 billion in Year 11, an increase of 6%, ex- pally from accruals for long-term incentive compensa- cluding divested businesses and discontinued product tion plans reflecting changes in Campbell's stock price. lines, and the effects of foreign currency rates. Volume As discussed in the "Overview" section above, Year was approximately the same as in Year 10. 10 results include divestiture, restructuring, and un- usual charges of $339.1 million ($301.6 million or 4 Statements of Earnings $2.33 per share after taxes). Sales in Year 11 were even with Year 10. Excluding Equity in earnings of affiliates declined in Year 11 principally due to the disappointing performance at divested businesses and unprofitable product lines dis- Arnotts and to a $4.0 million gain on sales of busi- continued during Year 11, sales increased 4% while nesses realized by Arnotts in Year 10. volume declined approximately 2%. The decline in volume was caused by reduced year-end trade promo- Year 10 Compared to Year 9 tional activities and the adverse effect of the recession on certain premium products. 5 Results by Division Gross margins improved 2.6 percentage points to 34.0% in Year 11 from 31.4% in Year 10. All divisions Campbell North America. In Year 10, Campbell North improved due to the significant benefits from restruc America had operating earnings of $396.4 million turing and the divestitures and product-pruning activ- after restructuring charges of $128.4 million. In Year ities. Productivity improvements worldwide and 9 the division had operating earnings of $266.1 declining commodity prices also contributed to the million, after restructuring charges of $189.1 million. higher margins. Excluding restructuring charges from both Year 10 Marketing and selling expenses, as a percentage of and Year 9 operating earnings increased 15% in Year net sales, were 15.4% in Year 11 compared to 15.8% in 10, led by strong performances by the soup, grocery, Year 10. The decrease in Year 11 is due to more fo- "Mrs. Paul's" frozen seafood, and Canadian sectors. cused marketing efforts and controlled new product The olives business performed poorly in Year 10. introductions. For each of the prior 10 fiscal years, Sales increased 8% in Year 10 to $4.32 billion on a these expenses had increased significantly. Advertising 3% increase in volume. There were solid volume in- was down 11% in Year 11. Management expects adver- creases in ready-to-serve soups, "Great Starts" frozen tising expenditures to increase in Year 12 in order to breakfasts, and "Prego" spaghetti sauces. Overall soup drive volume growth of core products and to support volume was up 1%. "Mrs. Paul's" regained the number the introduction of new products. one share position in frozen prepared seafood. Administrative expenses, as a percentage of net sales, were 4.9% in Year 11 compared to 4.7% in Year Campbell Biscuit and Bakery. In Year 10, Campbell Biscuit 10. The increase in Year 11 results principally from and Bakery had operating earnings of $65.9 million annual executive incentive plan accruals due to out- after restructuring charges of $25,3 million. In Year 9 standing financial performance and foreign currency the division's operating earnings were $65.3 million rates. after restructuring charges of $16.6 million. Excluding Interest expense increased in Year 11 due to timing restructuring charges from both Year 10 and Year 9, of fourth quarter borrowings in order to obtain favor- operating earnings of the division increased 11% in Year able long-term interest rates. Interest income was also 10. The increase in operating earnings was driven by higher in Year 11 as the proceeds from these borrow- Pepperidge Farm's biscuit and bakery units along with ings were invested temporarily until needed. Interest Arnott's gain on sales of businesses. Pepperidge Farm's expense, net of interest income, decreased from $94.0 frozen unit and Delacre performed poorly. Sales in- million in Year 10 to $90.2 million in Year 11 as the creased 7% to $777.3 million. Volume increased 1%, with increased cash flow from operations exceeded cash Pepperidge Farm's biscuit, bakery and food service used for share repurchases and acquisitions. units and Delacre the main contributors to the growth.MANAGEMENT'S DISCUSSION AND ANALYSIS OF RESULTS OF OPERATIONS AND FINANCIAL CONDITION . . . . . . . . . . . . . . . Campbell International. In Year 10, Campbell International were lower due to the shift in temporary investments had an operating loss of $168.6 million after restruc described in the previous paragraph. turing charges of $185.4 million. In Year 9, the division Other expense was $14.7 million in Year 10 compared sustained an operating loss of $117.8 million after re- to $32.4 million in Year 9. This decline results principally structuring charges of $137.3 million. Excluding from reduced accruals for long-term incentive compensa- restructuring charges from both Year 10 and Year 9, tion plans reflecting changes in Campbell's stock price. operating earnings declined 14% in Year 10, as As discussed in the "Overview" section above, results strong performances in the European Food and include divestiture, restructuring and unusual charges Confectionery and Argentine operations were more than of $339.1 million ($301.6 million or $2.33 per share offset by poor performances in the United Kingdom after taxes) in Year 10 and $343.0 million ($260.8 mil- frozen food and Italian biscuit operations. Sales in lion or $2.02 per share after taxes) in Year 9 Year 10 were $1.19 billion, an increase of 15%. Volume Equity in earnings of affiliates increased in Year 10 was up 14% of which 11% came from acquisitions. principally due to a $4.0 million gain on sales of busi- nesses realized by Arnotts in Year 10. 6 Statements of Earnings 7 Income Taxes In Year 10 sales increased 9% on a 5% increase in volume, about half of which came from established The effective income tax rate was 39.8% in Year 11, businesses. 97.5% in Year 10 an 87.7% in Year 9. The principal Gross margins improved by 1.9 percentage points to reason for the high tax rates in Year 10 and Year 9 is 31.4% in Year 10 from 29.5% in Year 9. All divisions had that certain of the divestiture, restructuring and un- improved margins in Year 10, with Campbell North usual charges are not tax deductible. Excluding the America operations posting substantial improvements. effect of these charges, the rate would be 41.0% in Year Marketing and selling expenses, as a percentage of 10 and 38.9% in Year 9. The variances in all years are net sales, were 15.8% in Year 10 compared to 14.4% in principally due to the level of certain foreign losses for Year 9. The Year 10 increase was due to heavy market- which no tax benefit is currently available. ing expenditures by Campbell U.S.A. at both the na- tional and regional levels. 8 Inflation Administrative expenses, as a percentage of net sales, were 4.7% in Year 10 compared to 4.4% in Year The Company attempts to mitigate the effects of infla- 9. The increase in Year 10 was driven by some unusual tion on sales and earnings by appropriately increasing one-time expenditures, employee benefits, the weak- selling prices and aggressively pursuing an ongoing ening dollar and acquisitions. Interest expense increased in Year 10 due to higher cost improvement effort which includes capital invest- ments in more efficient plants and equipment. Also, debt levels resulting from funding of acquisitions, the divestiture and restructuring programs enacted in higher inventory levels during the year, purchases of Year 9 and Year 10 have made the Company a more Campbell's stock for the treasury and restructuring cost-effective producer, as previously discussed with program expenditures. Interest income declined in reference to cost of products sold. Year 10 because of a shift from local currency to lower- yielding dollar denominated temporary investments in 10 Liquidity and Capital Resources Latin America to minimize foreign exchange losses. Foreign exchange losses resulted principally from The Consolidated Statements of Cash Flows and Bal- currency devaluations in Argentina. There was a large ance Sheets demonstrate the Company's continued su- devaluation in Argentina in Year 9. Also, Year 10 losses perior financial strength.CAMPBELL SOUP COMPANY 11 Statements of Cash Flows Dividends of $137.5 million represent the dividends Operating Activities. Cash provided by operations was paid in Year 11. Dividends declared in Year 11 were $142.2 $805.2 million in Year 11, an 80% increase from million or $1.12 per share, an increase of 14% over Year 10. $448.4 million in Year 10. This increased cash flow 12 Balance Sheets was driven by the Company's record earnings level and reduced working capital resulting from improved asset management and the restructuring program. Total borrowings at the end of fiscal Year 11 were $1.055 billion compared to $1.008 billion at the end of Year 10. Investing Activities. The majority of the Company's Even after the effects of the borrowing and treasury stock investing activities involve the purchase of new plant activity previously discussed, total debt as a percentage of assets to maintain modern manufacturing processes total capitalization was 33.7%-the same as a year ago. and increase productivity. Capital expenditures for The Company has ample sources of funds. It has access plant assets amounted to $371.1 million in Year 11, to the commercial paper markets with the highest rating. including $10.0 million of capital lease activity, down The Company's long-term debt is rated double A by the slightly from Year 10. The Company expects capital major rating agencies. It has filed a shelf registration with expenditures in Year 12 to be about $400 million. the Securities and Exchange Commission for the issu- Another key investing activity of the Company is ac- ance from time to time of up to $100 million of debt quisitions. The total cost of acquisitions in Year 11 was securities. Also, the Company has unused lines of credit $180.1 million, most of which was spent to acquire the of approximately $635 million. publicly held shares of the Company's 71% owned sub- Debt-related activity is discussed in the Statements of sidiary, Campbell Soup Company Lid. in Canada. This Cash Flows section above. In addition to that, the debt will allow Campbell North America to more efficiently balances on the Balance Sheets were affected by current integrate its U.S. and Canadian operations to provide maturities of long-term debt and by the classification of Campbell with competitive advantage in North America commercial paper to be refinanced as long-term debt in One of the Company's strategies has been to prune low- Year 10. return assets and businesses from its portfolio. In Year 11 Aggressive management of working capital and the the Company realized over $100 million in cash from effect of divested businesses are evidenced by a $235.5 these activities, with $67.4 million coming from sales of million decrease in current assets exclusive of changes businesses and $43.2 million realized from asset sales. in cash and temporary investments. Receivables are Also, during Year 11 the Company made contribu- down $97.1 million and inventories declined $113.1 tions to its pension plans substantially in excess of the million from Year 10. Accounts payable are down $42.8 amounts expensed. This was the principal reason for the million because of the reduced inventory levels and increase in other assets. divestitures. Accrued liabilities and accrued income taxes declined $61.9 million as increases due to higher Financing Activities. During Year 11, the Company issued debt in the public markets for a total of $400 million: $100 earnings levels and the timing of certain payments were million of 9% Notes due Year 18. $100 million of offset by payments and charges resulting from the divestitures and restructuring programs. Medium-Term Notes due Year 21 at interest rates from 8.58% to 8.75%, and $200 million of 8.875%. Plant assets increased $72.7 million due to capital expenditures of $371.1 million offset by the annual pro- Debentures due Year 41. The proceeds were used to vision for depreciation of $194.5 million, asset sales and reduce short-term debt by $227 million, pay off long- divestitures. Intangible assets increased $52.1 million as term debt maturing in Year 11 of $129.9 million, and the acquisitions resulted in $132.3 million of additional to fund the purchase of the minority interest of goodwill, Amortization and divestitures accounted for Campbell Canada. the remainder of the change. Other assets increased During Year 11, the Company repurchased approxi- principally as the result of the pension contribution. mately 3.4 million shares of its capital stock at a cost Other liabilities decreased $14.9 million as the re- of $175.6 million. Cash received from the issuance of duction of minority interest resulting from the pur- approximately 1.1 million treasury shares pursuant chase of the publicly-held shares of Campbell Canada to the stock option and long-term incentive plans and changes in foreign currency rates of other liabili amounted to $47.7 million in Year 11. ties offset the annual deferred tax provision.CAMPBELL SOUP COMPANY Consolidated Statements of Earnings (millions) Year 11 Year 10 Year 9 13 NET SALES $6,204.1 $6,205.8 $5,672.1 Costs and expenses 14 Cost of products sold 4,095.5 4,258.2 4,001.6 15 Marketing and selling expenses 956.2 980.5 818.8 16 Administrative expenses 306.7 290.7 252.1 Research and development expenses 56.3 53.7 47.7 Interest expense (Note 3) 116.2 111.6 94.1 Interest income (26.0) (17.6) (38.3) Foreign exchange losses, net (Note 4) .8 3.3 19.3 Other expense (Note 5) 26.2 14.7 32.4 Divestitures, restructuring and unusual charges (Note 6) 339.1 343.0 22A Total costs and expenses $5,531.9 $6,034.2 $5,570.7 23 Earnings before equity in earnings of affiliates and minority interests $ 672.2 $ 171.6 $ 101.4 24 Equity in earnings of affiliates 2.4 13.5 10.4 25 Minority interests (7.2) (5.7) (5.3) 26 Earnings before taxes 667.4 179.4 106.5 27 Taxes on earnings (Note 9) 265.9 175.0 93.4 28 Net earnings 401.5 4.4 13.1 29 Net earnings per share (Note 22) 3.16 .03 $ 10 30 Weighted average shares outstanding 127.0 129.6 129.3CAMPBELL SOUP COMPANY CONSOLIDATED BALANCE SHEETS (million dollars) July 28, July 29, Year 11 Year 10 Current Assets 31 Cash and cash equivalents (Note 12) $178.9 $80.7 32 Other temporary investments, at cost which approximates market 12.8 22.5 33 Accounts receivable (Note 13) 527.4 624.5 34 Inventories (Note 14) 706.7 819.8 35 Prepaid expenses (Note 15) 92.7 118.0 36 Total current assets 1,518.5 1,665.5 37 Plant assets, net of depreciation (Note 16) 1,790.4 1,717.7 38 Intangible assets, net of amortization (Note 17) 435.5 383.4 39 Other assets (Note 18) 404.6 349.0 Total assets $4,149.0 $4,115.6 Current Liabilities 40 $282.2 $202.3 EI Notes payable (Note 19) Payable to suppliers and others 482.4 525.2 42 Accrued liabilities (Note 20) 408.7 491.9 43 Dividend payable 37.0 32.3 44 Accrued income taxes 67.7 46.4 45 Total current liabilities 1,278.0 1,298.1 46 Long-term debt (Note 19) 772.6 805.8 47 Other liabilities, principally deferred income taxes (Note 21) 305.0 319.9 Shareowners' Equity (Note 22) 48 Preferred stock; authorized 40,000,000 shares; none issued Capital stock, $.15 par value; authorized 140,000,000 shares; issued 135,622,676 shares 20.3 20.3 Capital surplus 107.3 61.9 Earnings retained in the business 1,912.6 1,653.3 52 Capital stock in treasury, 8,618,911 shares in Year 11 and 6,353,697 shares in Year 10, at cost (270.4) (107.2) 53 Cumulative translation adjustments (Note 4) 23.6 53.5 54 Total shareowners' equity 1,793.4 1,691.8 55 Total liabilities and shareowners' equity $4,149.0 $4,115.6CAMPBELL SOUP COMPANY CONSOLIDATED STATEMENTS OF CASH FLOWS (million dollars) Year 11 Year 10 Year 9 Cash Flows from Operating Activities 56 Net earnings $401.5 $4.4 $13.1 To reconcile net earnings to net cash provided by operating activities: Depreciation and amortization 208.6 200.9 192.3 Divestitures and restructuring provisions 339.1 343.0 Deferred taxes 35.5 3.9 (67.8) Other, net 63.2 18.6 37.3 (Increase) decrease in accounts receivable 17.1 (60.4) (46.8) (Increase) decrease in inventories 48.7 10.7 (113.2) Net change in other current assets and liabilities 30.6 (68.8) (.6) Net cash provided by operating activities 805.2 448.4 357.3 Cash Flows from Investing Activities Purchases of plant assets (361.1) (387.6) (284.1) Sales of plant assets 43.2 34.9 39.8 Businesses acquired (180.1) (41.6) (135.8) Sales of businesses 57.4 21.7 4.9 Increase in other assets (57.8) (18.6) (107.0) Net change in other temporary investments 9.7 3.7 9.0 Net cash used in investing activities (478.7) (387.5 (473.2) Cash Flows from Financing Activities Long-term borrowings 402.8 12.6 126.5 Repayments of long-term borrowings (129.9) (22.5) (53.6) Increase (decrease) in borrowings with less than three month maturities (137.9) (2.7) 108.2 Other short-term borrowings 117.3 153.7 227.1 Repayments of other short-term borrowings (206.4) (89.8) (192.3) Dividends paid (137.5) (124.3) (86.7) Treasury stock purchases (175.6) (41.1) (8.1) Treasury stock issued 47.7 12.4 18.5 80 Other, net (.1) (.1) 23.5 Net cash provided by (used in) financing activities (219.6) (101.8) 163.1 82 Effect of exchange rate changes on cash (8.7) .7 (12.1) 83 Net increase (decrease) in cash and cash equivalents 98.2 (40.2) 35.1 84 Cash and cash equivalents at beginning of year 80.7 120.9 85.8 85 Cash and cash equivalents at end of year $178.9 $80.7 $120.9CAMPBELL SOUP COMPANY CONSOLIDATED STATEMENTS OF SHAREOWNERS' EQUITY (million dollars) Earnings Capital Preferred Stock Capital Cumulative Total Capital Retained in the in Translation Shareowners' Stock Stock Surplus Business Treasury Adjustments Equity 86 Balance at July 31, Year 8 $20.3 $42.3 $1,879.1 $(75.2 $28.5 $1,895.0 Net earnings 13.1 13.1 Cash dividends ($.90 per share) (116.4) (116.4) Treasury stock purchased (8.1) (8.1) Treasury stock issued under Management incentive and Stock option plans 8.5 12.6 21.1 Translation adjustments (26.4 26.4 87 Balance at July 30, Year 9 20.3 50.8 1,775.8 (70.7) 2.1 1,778.3 Net earnings 4.4 4.4 Cash dividends ($.98 per share) (126.9) (126.9) Treasury stock purchased (41.1) (41.1) Treasury stock issued under Management incentive and Stock option plans 11.1 4.6 15.7 Translation adjustments 61.4 61.4 Balance at July 29, Year 10 20.3 61.9 1,653.3 (107.2) 63.5 1,691.8 38 Net earnings 401.5 401.5 39 Cash dividends ($1.12 per share) (142.2) (142.2) 90 Treasury stock purchased (175.6) (175.6) 91 Treasury stock issued under Management incentive and Stock option plans 45.4 12.4 57.8 92 Translation adjustments (29.9) (29.9) 93 Sale of foreign operations (10.0) 10.0) 94 Balance at July 28, Year 11 - $20.3 $107.3 $1,912.6 $ (270.4) $23.6 $1,793.4 95 Changes in Number of Shares (thousands of shares) Out- In Issued standing Treasury Balance at July 31, Year 8 135,622.7 129,038.6 6,584.1 Treasury stock purchased (250.6) 250.6 Treasury stock issued under Management incentive and Stock option plans 790.6 (790.6 Balance at July 30, Year 9 135,622.7 129,578.6 6,044.1 Treasury stock purchased (833.0) 833.0 Treasury stock issued under Management incentive and Stock option plans 523.4 (523.4) Balance at July 29, Year 10 135,622.7 129,269.0 6,353.7 Treasury stock purchased (3,395.4) 3,395.4 Treasury stock Issued under Management Incentive and Stock option plans 1,130.2 (1,130.2) Balance at July 28, Year 1 1 135,622.7 127,003.8 3,618.9
Step by Step Solution
There are 3 Steps involved in it

Get step-by-step solutions from verified subject matter experts


